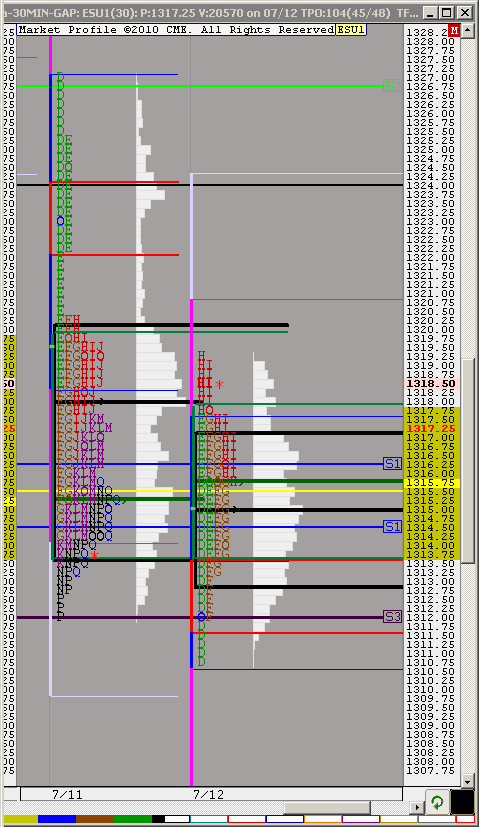
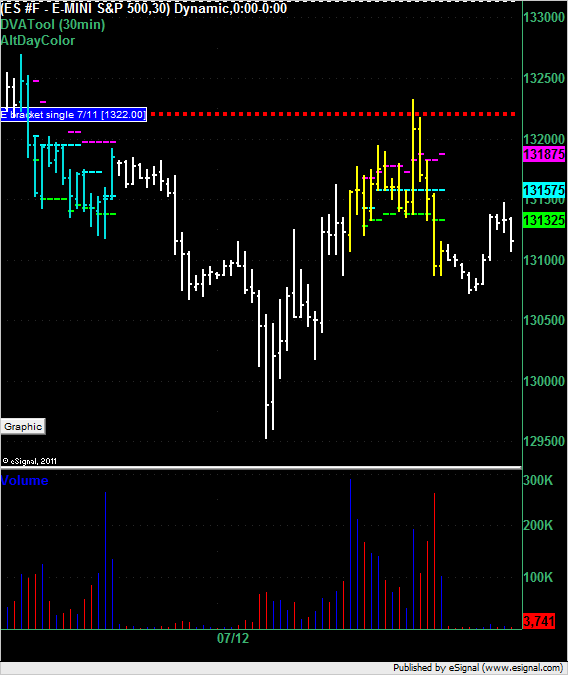
ES TUES 7-12-11
The overnight Low was 1295.25
50% of last month's RTH range = 1294.00
50% of last month's 24hr range = 1297.25
IMHO, Low for the 24hour is probably already in
This is OpEx week. specialists have already sucked the premium out of the calls. Maybe it's time for them to sell the premium inflated Puts before they come in with fists-o-cash to push prices higher for a premium wipeout of the puts.
50% of the current week is 1317.25, Pivot (RTH) for today is 1319, this zone should be tagged.
DT will you please explain the meaning of the intials on the market profile you just posted for example what is DF. DEFG. EF.......
Thanks
I use em on my charts
30 min and hourly 1319, 1 min and up, 1315
Question.
To post a link do you just insert the url between those brackets?
tia
I use em on my charts
30 min and hourly 1319, 1 min and up, 1315
Question.
To post a link do you just insert the url between those brackets?
tia
Originally posted by Lisa P
DavidS, see the PP and other numbers on MyPivots page, refreshed daily
http://www.mypivots.com/dailynotes/symbol/445/-1/e-mini-sp500-september-2011
Originally posted by DavidS
Thanks
I use em on my charts
30 min and hourly 1319, 1 min and up, 1315
Question.
To post a link do you just insert the url between those brackets?
tiaOriginally posted by Lisa P
DavidS, see the PP and other numbers on MyPivots page, refreshed daily
http://www.mypivots.com/dailynotes/symbol/445/-1/e-mini-sp500-september-2011
I just copy and paste for a link
lISA WHY YOUR NUMBERS O/N THE INDU CHART YOU JUST DISPLAYED ARE DIFFERENT THAN DT NUMBERS HE POSTED FOR TODAY HE POSTED AS VAH 12532
YOURS IS 12523 IS IT A TYPING ERROR? IF NOT I WOULD LIKE TO HEAR FROM YOU AND DT AS WELL
YOURS IS 12523 IS IT A TYPING ERROR? IF NOT I WOULD LIKE TO HEAR FROM YOU AND DT AS WELL
Originally posted by khamore1kHAMORE, INDU is a cash market, the number posted on MyPivots probably are for YM (futures).
lISA WHY YOUR NUMBERS O/N THE INDU CHART YOU JUST DISPLAYED ARE DIFFERENT THAN DT NUMBERS HE POSTED FOR TODAY HE POSTED AS VAH 12532
YOURS IS 12523 IS IT A TYPING ERROR? IF NOT I WOULD LIKE TO HEAR FROM YOU AND DT AS WELL
Also my 12523 number is NOT the VAH for INDU, it is a level I watch
i like selling the 23 area if they can get it up there; a bunch of things going on there including 30m 1.618 projection (o/n lows to 12.5 move), daily pivot, and the 1.618 stretch number (for those who look at them); single prints from yesterday slightly below at 22 even....will add up in the 25-25.5 area if needed (and if it is not too late)..hopefully there will be some single prints lying below to play with/target
1317.25 still valid level and what I'm using
50% retrace level around 1325
61.8- yeah-1332
just fyiing
50% retrace level around 1325
61.8- yeah-1332
just fyiing
I have 132- as my over/under level. It is also yest's VAH. Above we have two sets of single prints. IF NQ co-operates, that would be a good long. Looking for another entry, as I closed my trade on ES gap close because NQ was not participating in this up move.
That was 1320 level. Sorry, was too fast typing
Just a single print recap from today. The single print left on the chart at 1322 even yesterday would have suffered a 1.25 point draw down if used as a short entry location.
Emini Day Trading /
Daily Notes /
Forecast /
Economic Events /
Search /
Terms and Conditions /
Disclaimer /
Books /
Online Books /
Site Map /
Contact /
Privacy Policy /
Links /
About /
Day Trading Forum /
Investment Calculators /
Pivot Point Calculator /
Market Profile Generator /
Fibonacci Calculator /
Mailing List /
Advertise Here /
Articles /
Financial Terms /
Brokers /
Software /
Holidays /
Stock Split Calendar /
Mortgage Calculator /
Donate
Copyright © 2004-2023, MyPivots. All rights reserved.
Copyright © 2004-2023, MyPivots. All rights reserved.

