JA
jarek
Rep: 94
Posts: 3,474
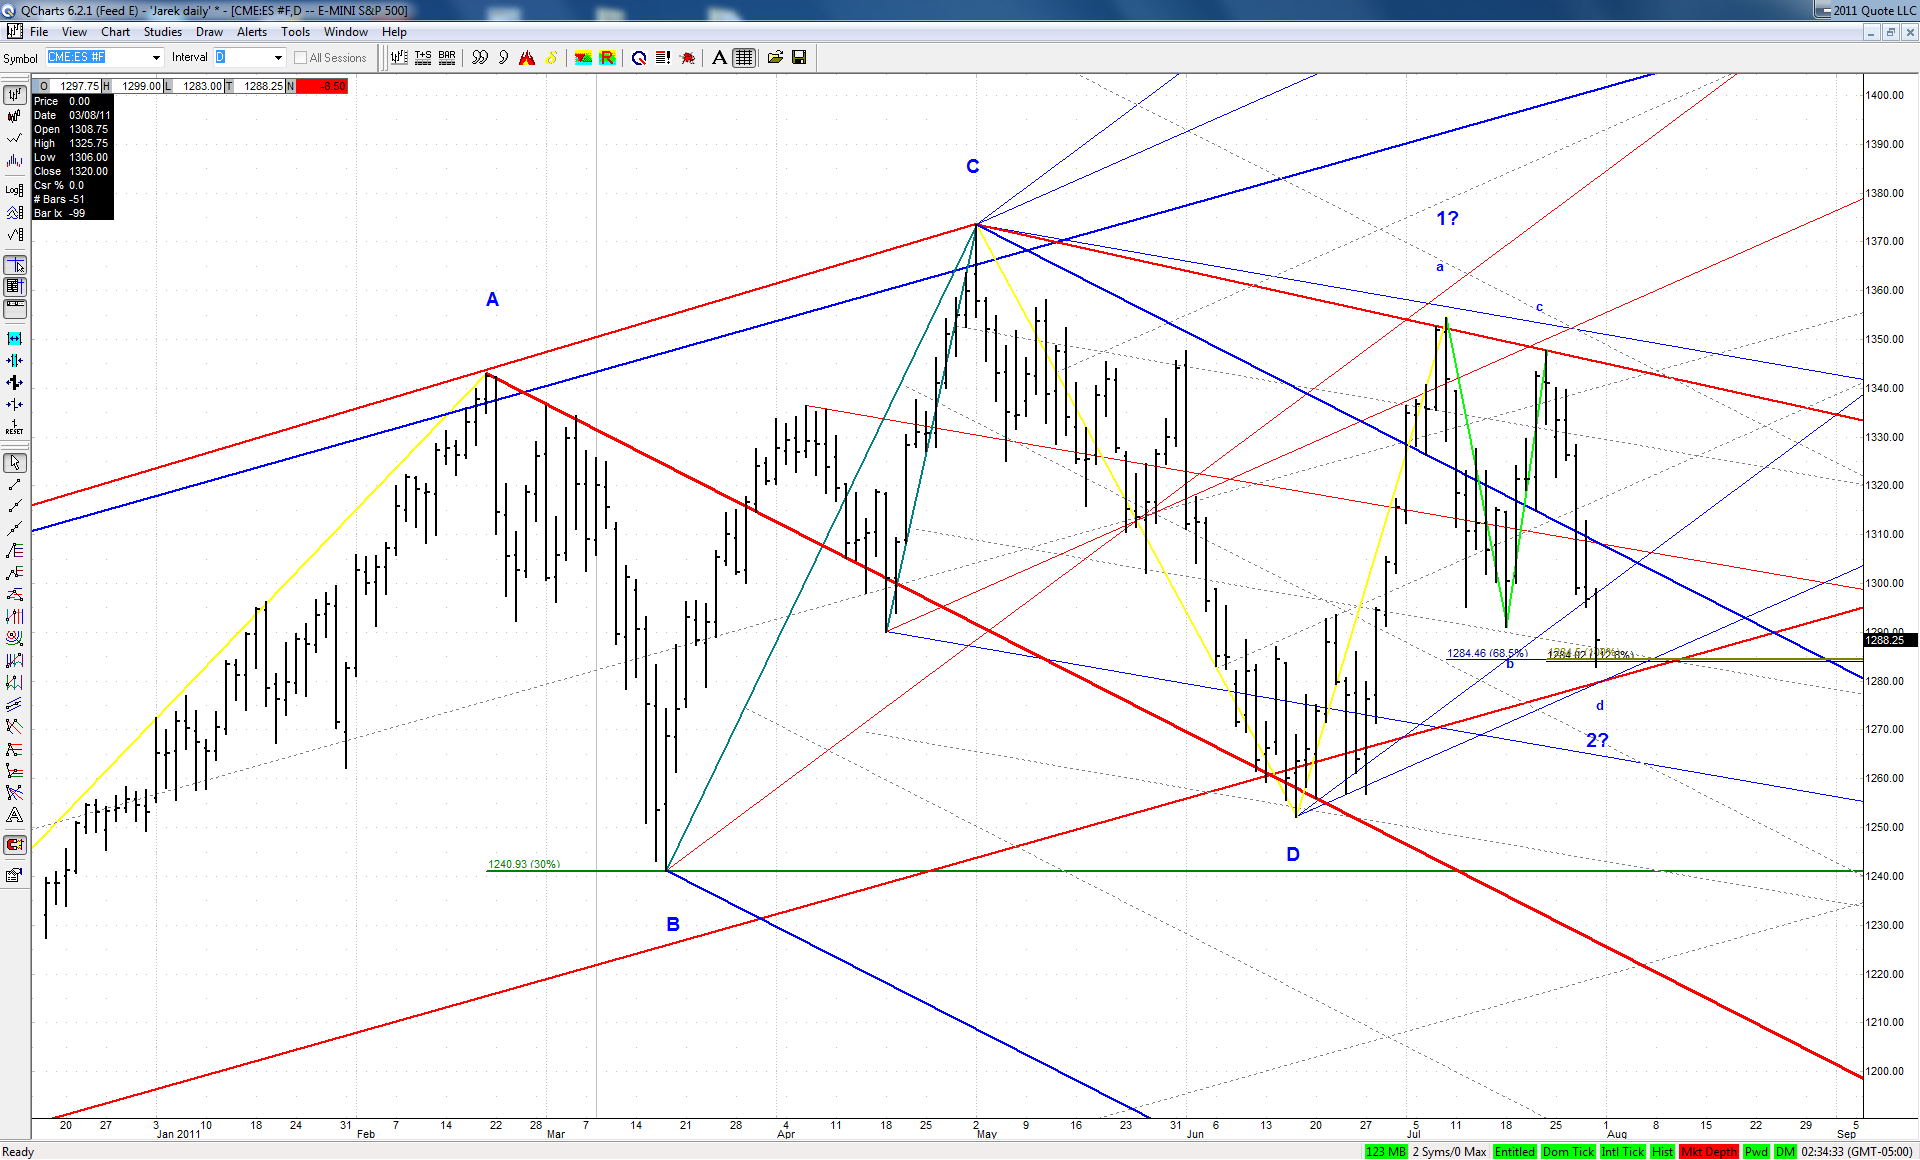
Welcome back everybody! I just returned for a one week break between my holidays and thought it won't be bad if I share some charts Here is the update of my daily ES chart:
JI
jimkane
Rep: 3,058
Posts: 33,089
Okay, so let's follow up on this. Recall my explanation posts about my posting of levels and why I do it. Why was I watching these levels? Why did I post them when I did? What use may they have been, if one understood my explanation about why I post them?
Let's look more closely at the levels. When this was posted the ES was around 1326. It goes down to 99.50 where it does the first small bounce, then rolls to 99.25 and another small bounce, then 98.00 near the close, where it then rolls sideways overnight and moves a bit upward, to 1306.25, where it then does a 1.272 to a new low of 95.75. So, it rolls around right on the area, and then in the usual morning ramp it runs to 1313, a nice 17.25 point bounce.
Notice, when looking at your chart as you read this (you must have ES all-sessions), how long it sat on the area. Point is, of all the areas I could have pointed out in advance, why did it go right to the very spot I mentioned, and then go sideways in the overnight, and then do a nice, tradable-sized ramp off the area? Of all the places it could have went...
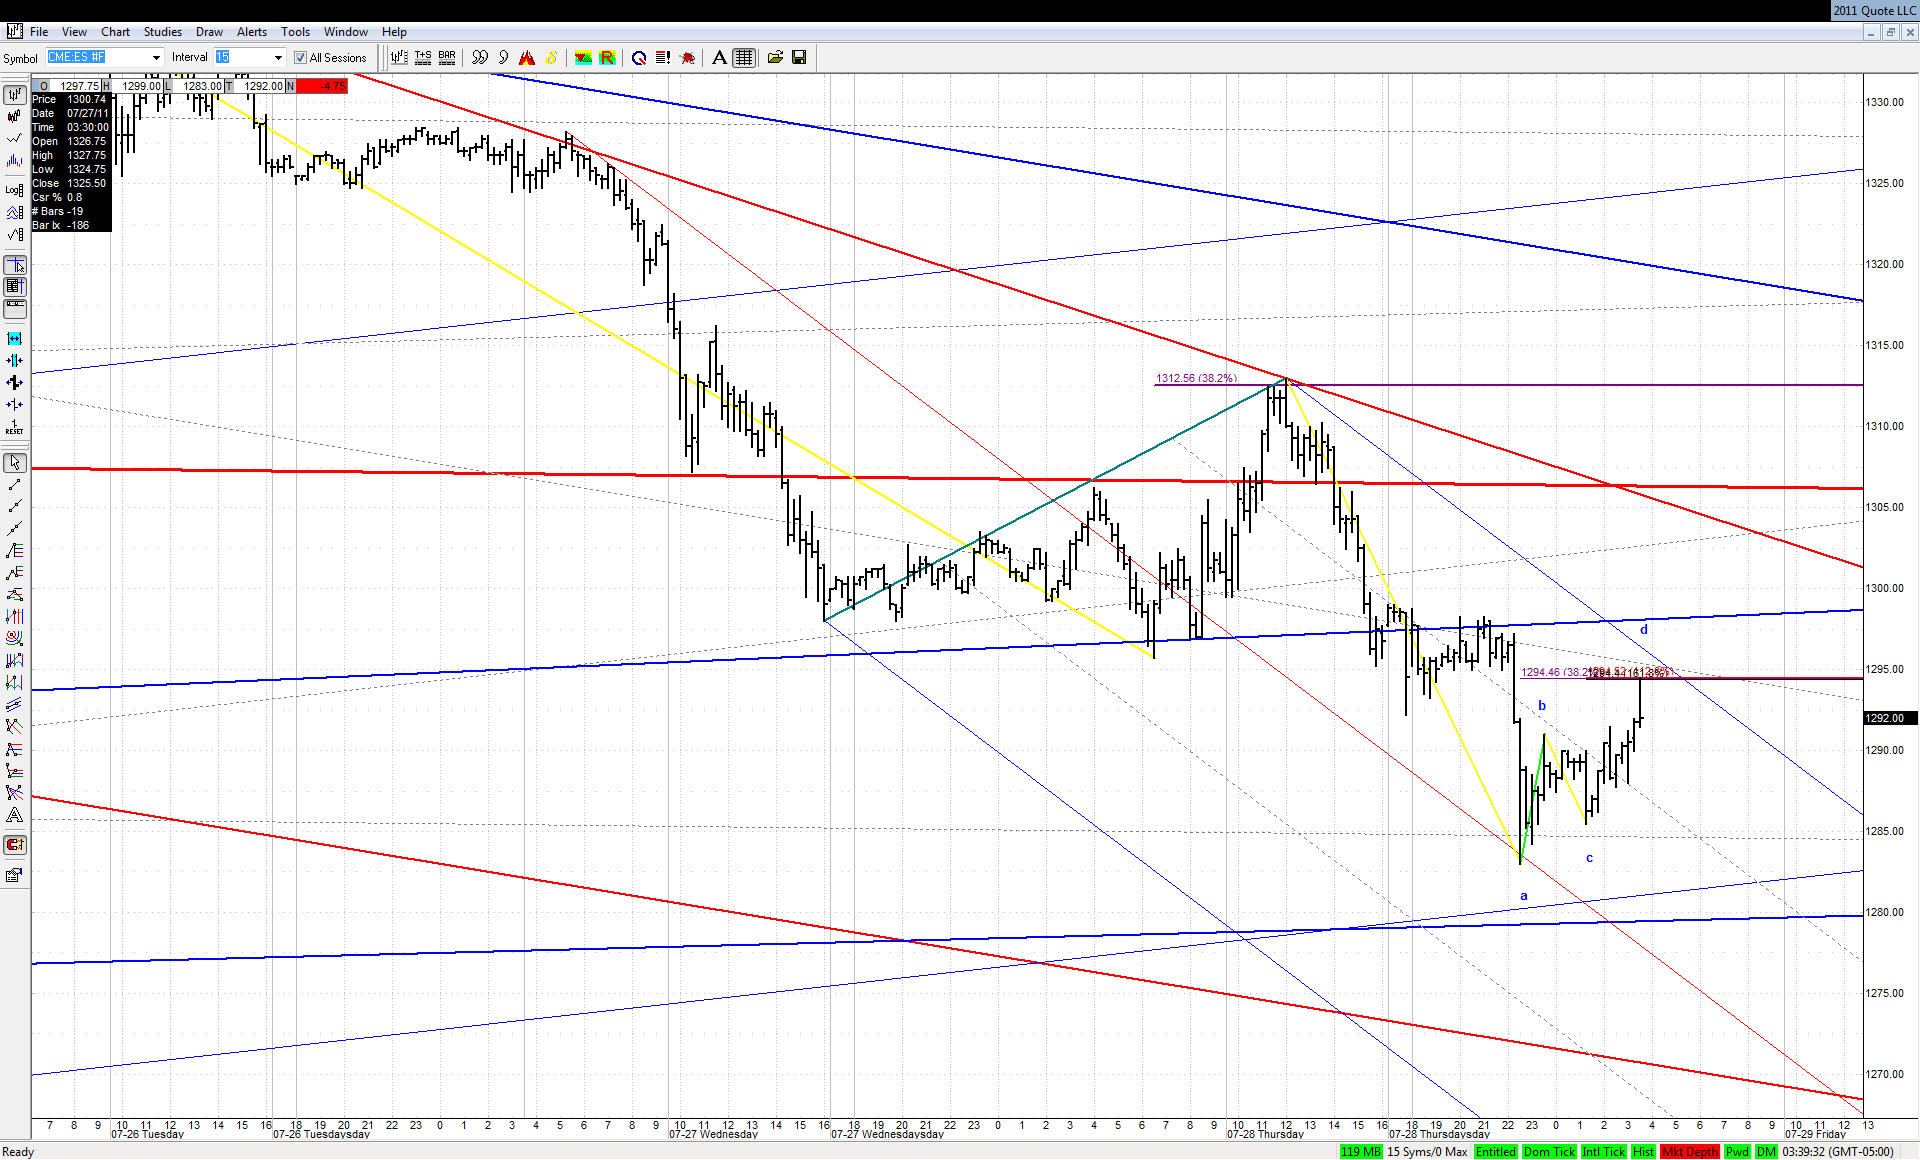
From there it rolled hard, and after some sideways congestion after the market closed, on 'news' about the debt nonsense it takes another plunge, to where? 1283. My next area was 80.25-84.50. Hmmmm. And off that 83 area it bounces up into a 1.000 ABCD within one tick. The bounce was 8 points so far. It may roll over in here off that sweet pattern. The point, again, is how come of all the places this could go to start bouncing, it happens to go right to both my areas, of all places on the chart it could go to, and stop dead, and bounce a bit? Why those areas?
There is nothing but the tools being used to do this, and most of those tools (surely enough to duplicate the areas, in my opinion) are detailed in the books and the free commentary on the website. Any additional tools I show my mentor students that are used should be clear to all the mentor students, but more than 90%, and all that is necessary, is in the books and free commentary.
What I am trying to show, again, is how can this move to these areas so precisely? It's not a claim, it's just something I find amazing. And I have shown the tools to do this. It shouldn't be a mystery. I post these levels so that everyone knows to pick one set of levels, and work until you see those levels clearly distinguish themselves from any other work you have. If that doesn't happen, you aren't there yet with your work. Why go on to another example if you can't do a particular one?
Like I say, practice doesn't make perfect, as they like to say, if the practice isn't improving your skills. If you can't figure it out and you move on and do another one you can't figure out, where are you going? How are you improving? Posting my levels, and reiterating just how incredibly they seem to be 'seen' at times, is my way of saying 'Did you have this ahead of time, like I did?' If not, work on it until you do.
Posted-07/27/2011 : 02:40:58
Originally posted by jimkane
If the ES heads down in any meaningful way (like that could happen...), I have two levels I am particularly interested in, 96.25-98.75 and 80.25-84.50, give or take...
JI
jimkane
Rep: 3,058
Posts: 33,089
73.50-75.75 is a key 1.272 overlap with the main, super-key higher timeframe lines that sent this up in that record-setting frenzy awhile back. I'd think the bulls wouldn't even want to get near it, for fear of losing control of such a key area. Keep in mind this is a higher timeframe area so the width of the area is wider. The lines are upsloping, too, and hence they are a moving target as time goes by.
In reality, the this area and the one it is 'seeing' right now are really two 'sub-harmonics' for the same spot, in my opinion. It's all about price action now. Then we see if they can really take this down to the next level without a bounce first (if they intend to drop it any more at all). We'll see. Very, very exciting action, in my opinion.
In reality, the this area and the one it is 'seeing' right now are really two 'sub-harmonics' for the same spot, in my opinion. It's all about price action now. Then we see if they can really take this down to the next level without a bounce first (if they intend to drop it any more at all). We'll see. Very, very exciting action, in my opinion.
JI
jimkane
Rep: 3,058
Posts: 33,089
Upside levels, short-term, in case we need them, are:
94.50-95.00 (.447 is at 96.41, 1.000 ABCD at 93.50, so in there somewhere?)
98.75-99.00
1303.50-4.75
Center of the areas, as usual. And I think we may be needing them, sooner than one might think...
94.50-95.00 (.447 is at 96.41, 1.000 ABCD at 93.50, so in there somewhere?)
98.75-99.00
1303.50-4.75
Center of the areas, as usual. And I think we may be needing them, sooner than one might think...
JI
jimkane
Rep: 3,058
Posts: 33,089
I have a curious time factor (I don't use time factors, per se, very much in my work, outside the timing from sets, lines, and Fib intersections) at the highest area at around 6 AM Eastern. The way this is starting to take off, I think it could easily do it. That would have it up just over 20 off the low it just put in, an amount they like to run it in such circumstances. The question is, if it gets there like that before the open, what then? How they handle this tonight is going to be very important, and full of clues, I think. Wish I could do an all-nighter, like T used to do.
JA
jarek
Rep: 94
Posts: 3,474
This is how it looks on daily - almost perfect 1.000 bullish ABCD:
Click image for original size
JA
jarek
Rep: 94
Posts: 3,474
First test of the uptrend - another .382 bearish ABCD:
Click image for original size
JA
jarek
Rep: 94
Posts: 3,474
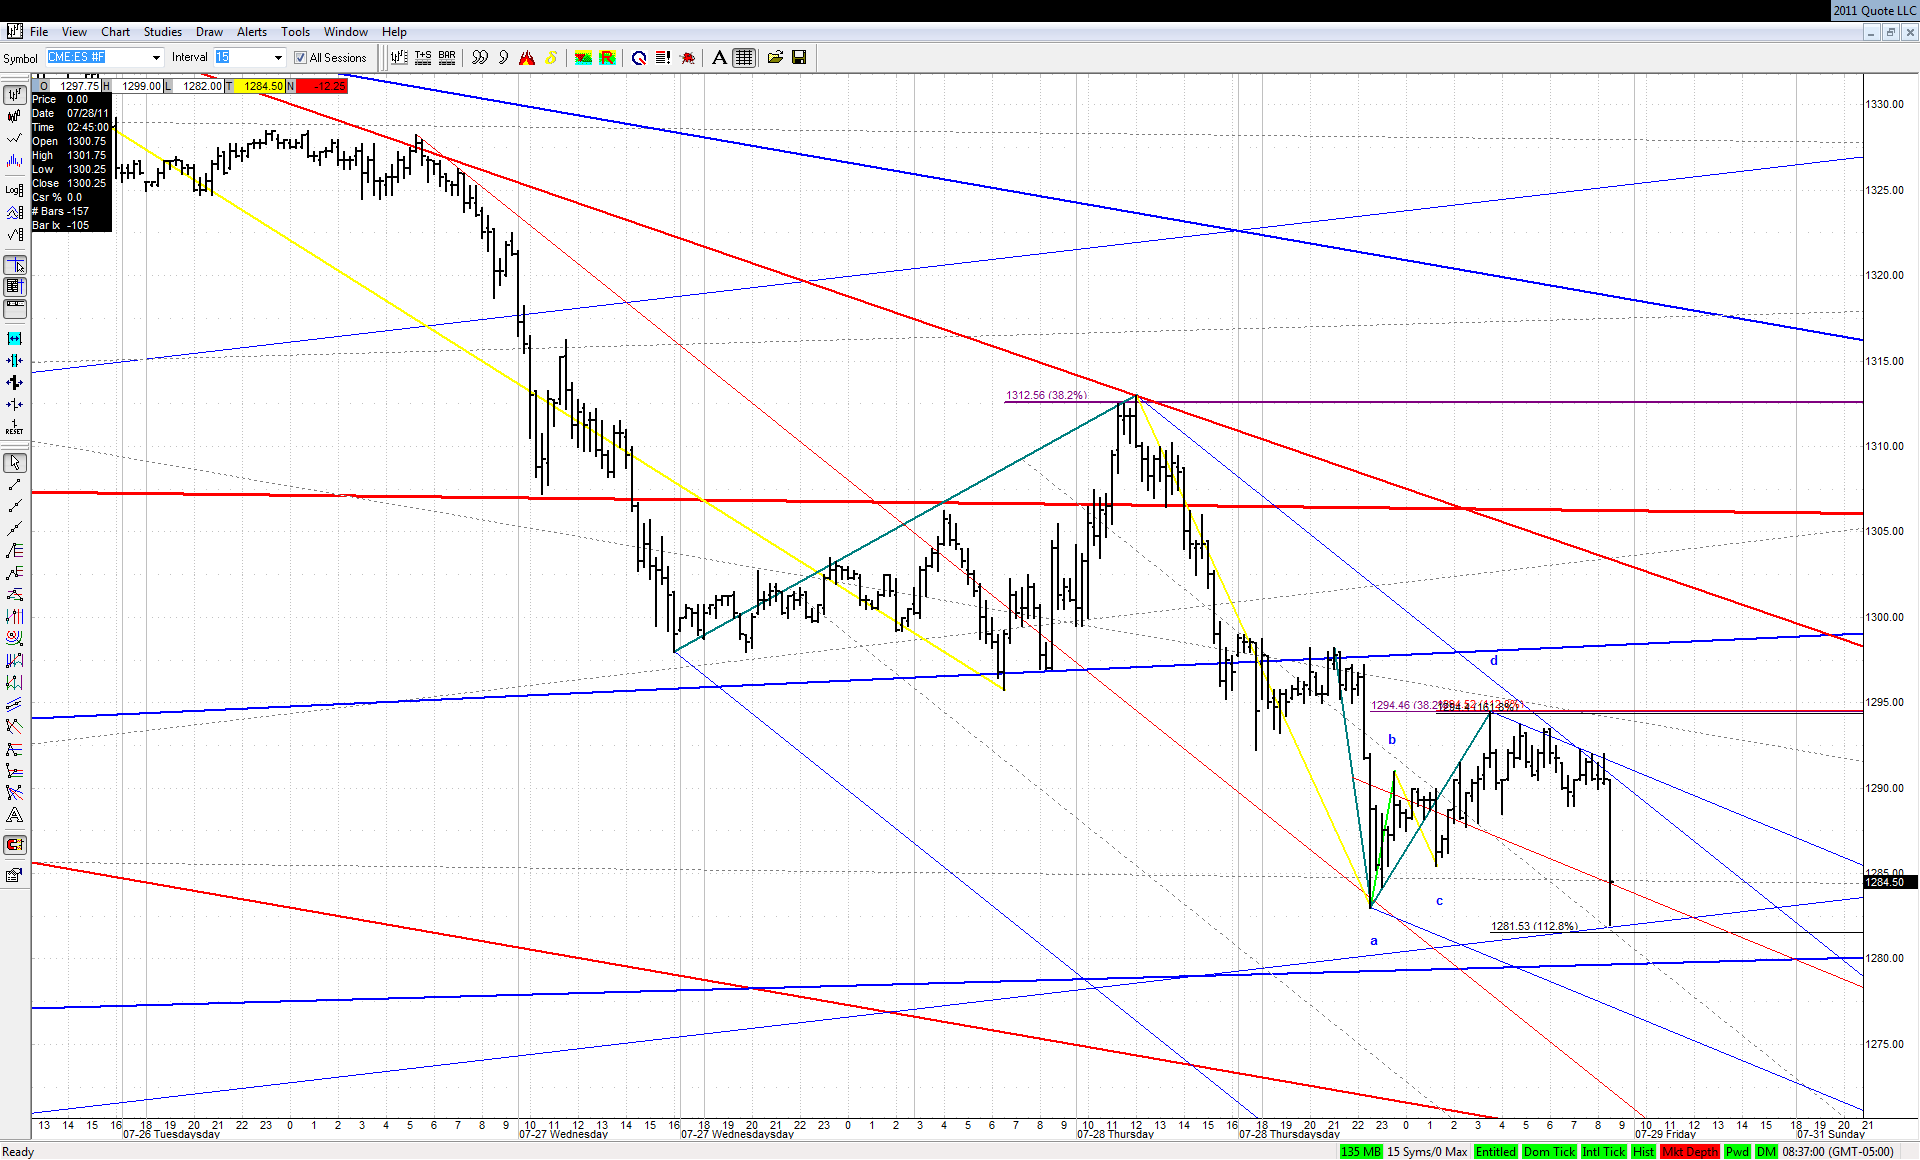
Straight to the next upsloping line on daily after the GDP number:
Click image for original size
JA
jarek
Rep: 94
Posts: 3,474
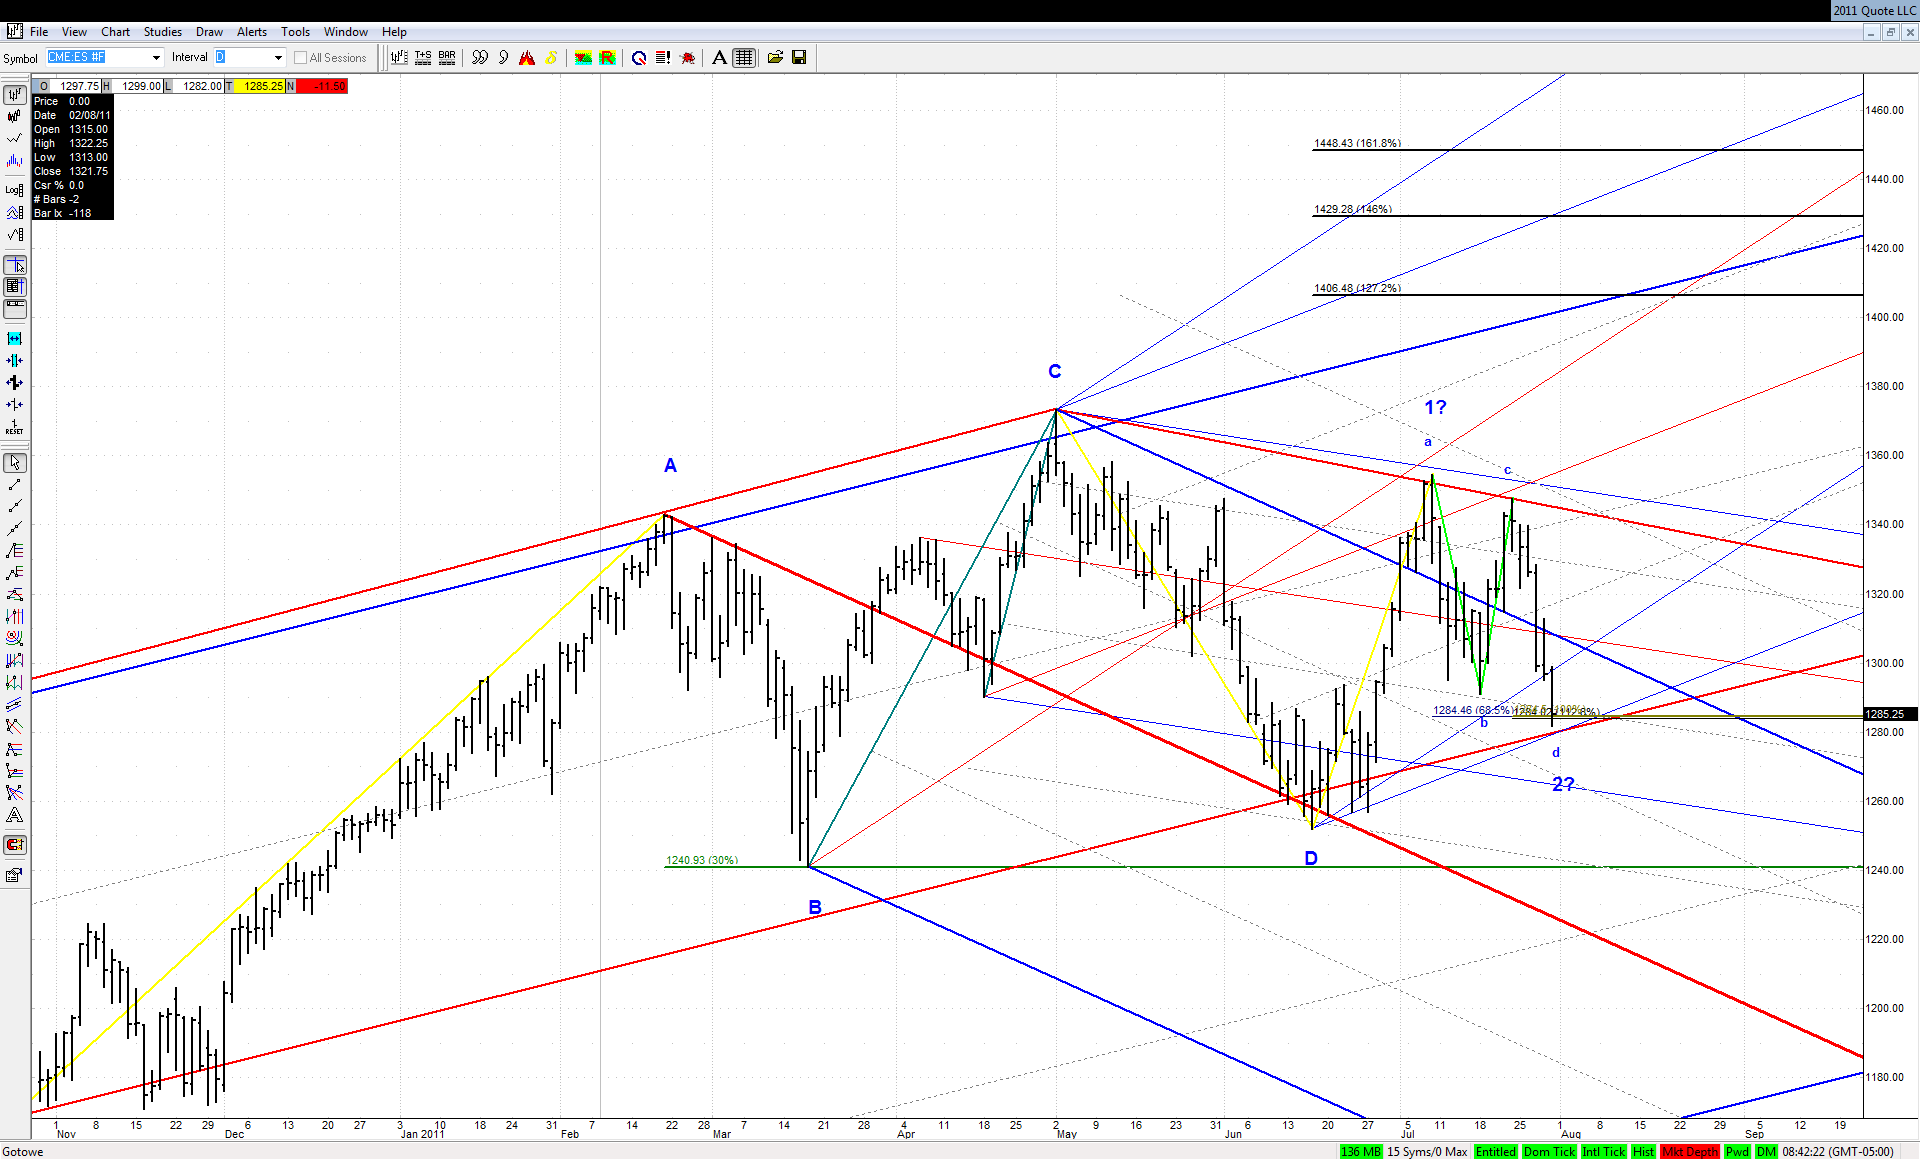
Our bullish W2 standard ABCD is still valid:
But if it fails, then we'll also have a failure of our big bullish TD ABCD spanning from Feb to June with all consequences...
Click image for original size
But if it fails, then we'll also have a failure of our big bullish TD ABCD spanning from Feb to June with all consequences...
JA
jarek
Rep: 94
Posts: 3,474
As scary as it may look, isn't a W2 bearish KZ 4PT forming here around Schiff ML??
Click image for original size
JA
jarek
Rep: 94
Posts: 3,474
... not 4PT, but a standard ABCD. The question is was this W2 or W4??
Click image for original size
JI
jimkane
Rep: 3,058
Posts: 33,089
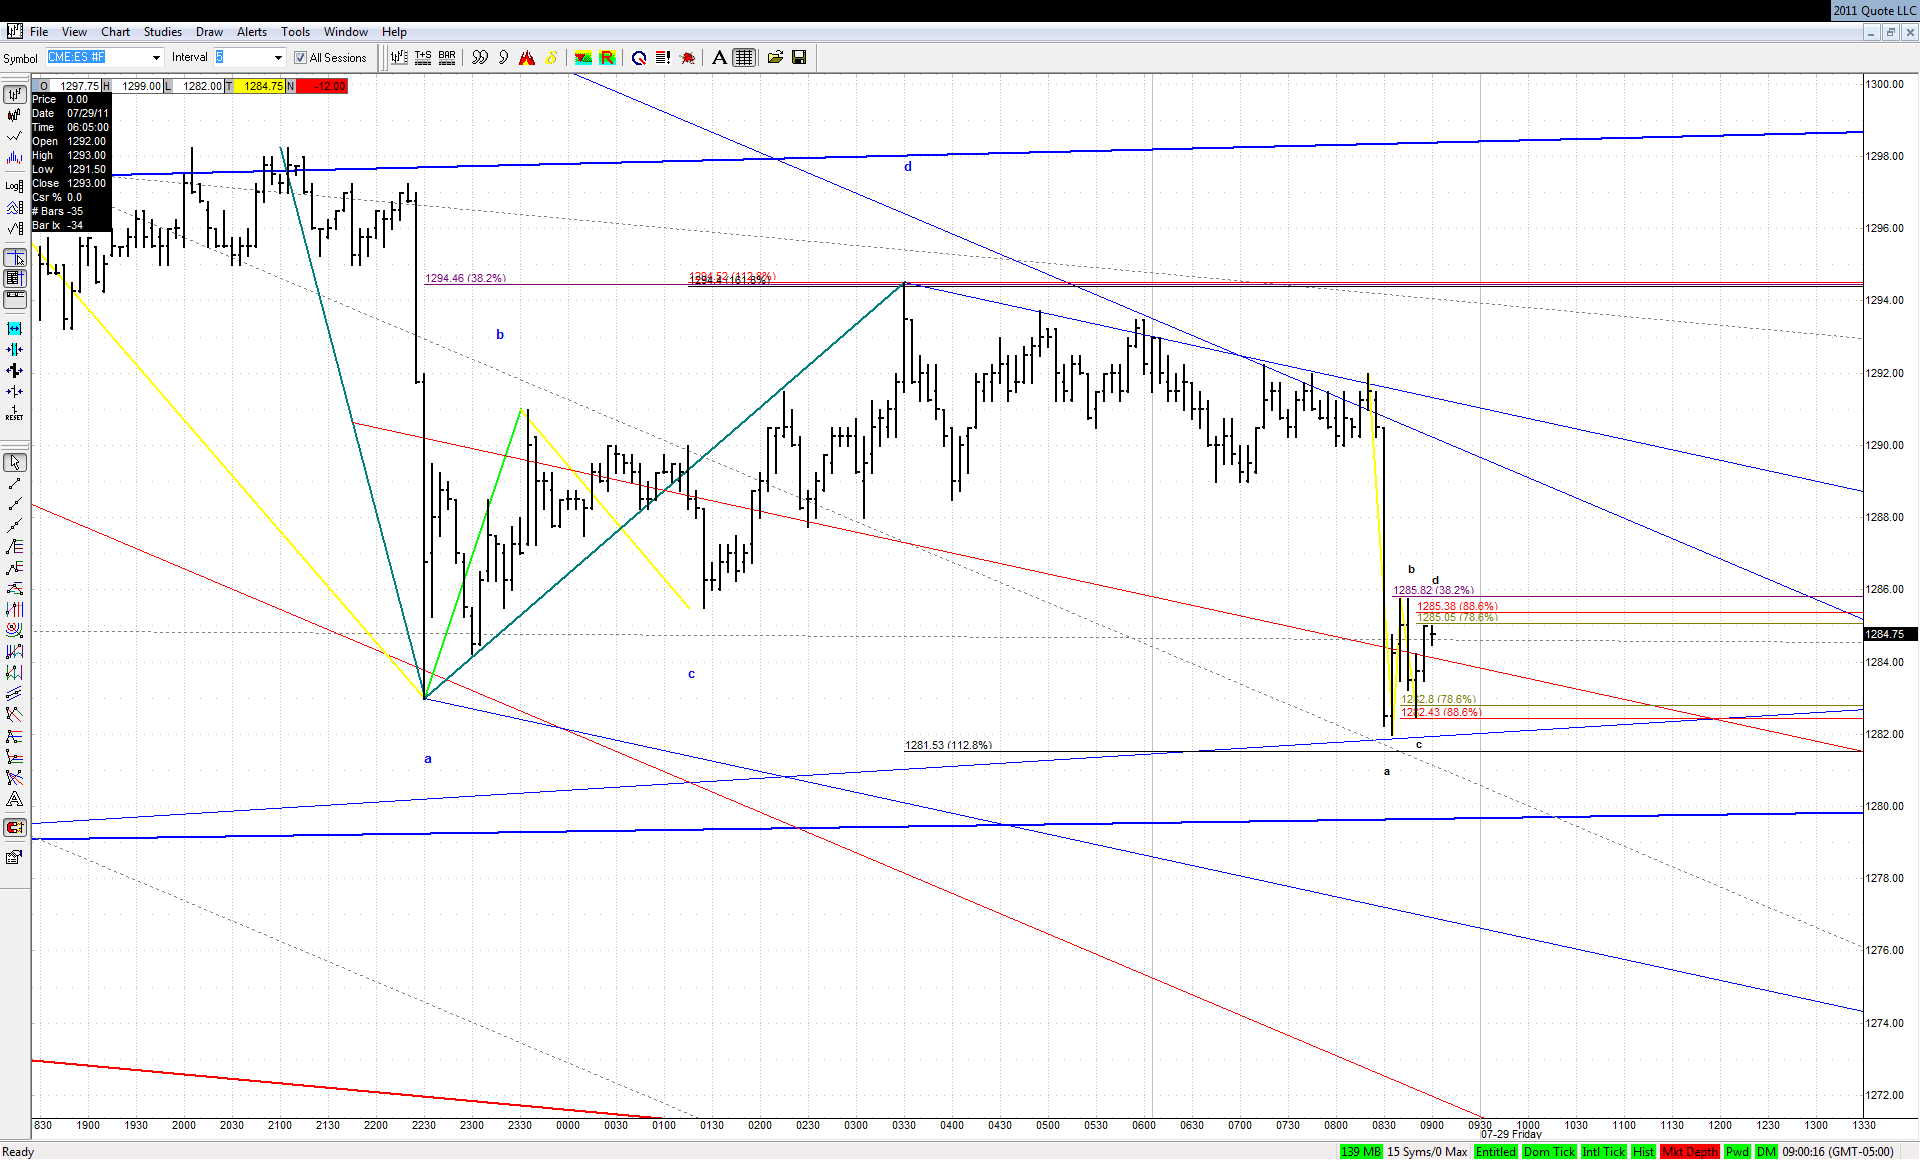
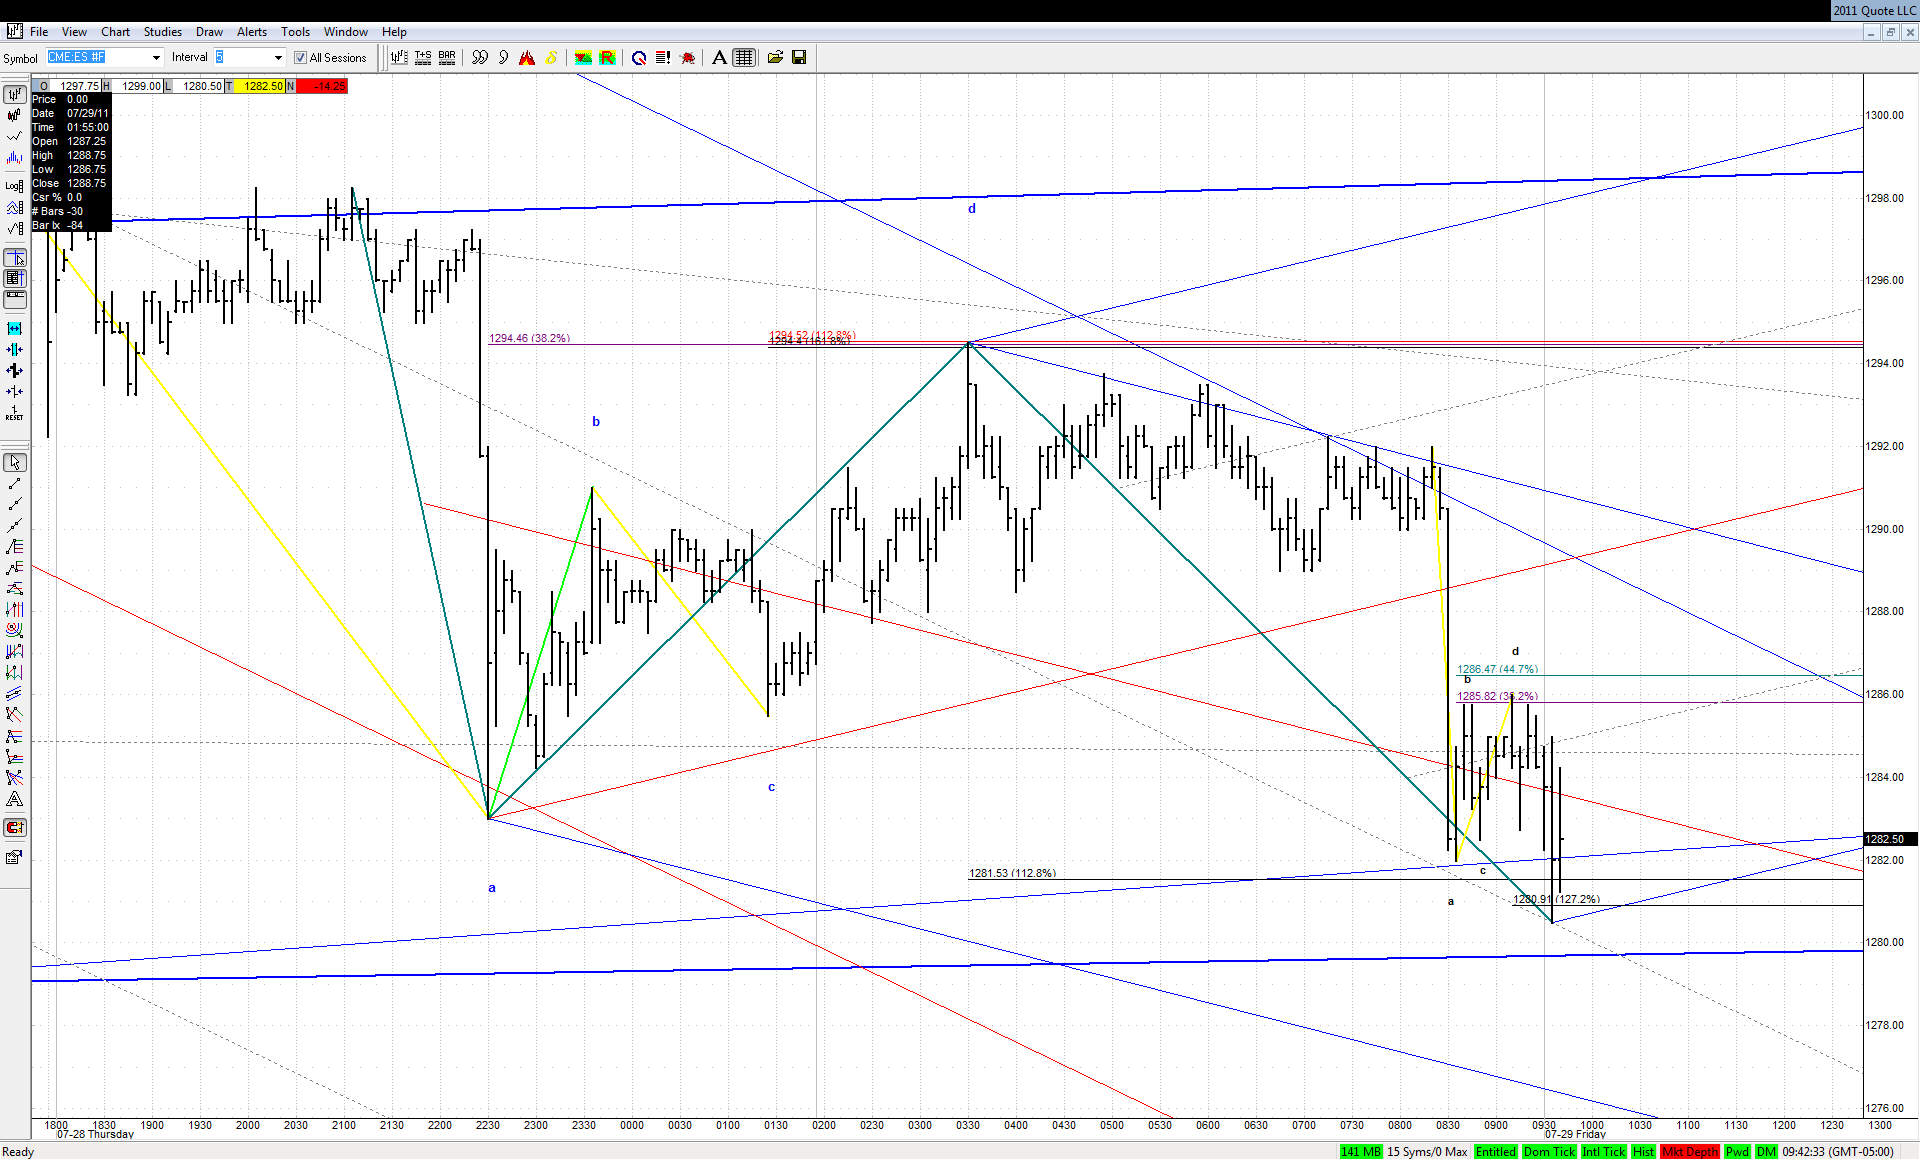
Let's follow up on this. Go to the time shown below on your ES all-sessions chart. The ES was around 1290. It rose from there to 1294.50. Note the first level posted below. It then began to drop. It did a very typical 'W1' first move (my mentor students would know just how typical this was, but that is not necessary information for this example), a nice 'W2' pullback, and then headed back down, hitting a new low for the move at 1278.50. That was a drop of 16 points off the area posted.
Although I didn't post this because it was the middle of the night for me, my key level once this started to sell off was hit within one tick of the center of my grouping level (and the small bounce on the way down was also at an area I'd expect that from). The bounce up after of 22.25 points was right between my two most critical lines (do an obvious TL!). Just amazing, to put it mildly. So, once again, the same point. How, of all the places on the chart this could have risen to and then sold off hard from, why, again, was it one of the levels I posted (in advance, of course)?
Now, I am not saying this is a panacea, or a way to riches. Everyone who has followed me for any length of time knows I am not even hinting at that. I don't know which level, if any, this will respect. I have to have an idea what I think will happen so that I know where I may trade, and on what side. This takes experience. And as I've said, the setup is only 10%-20% of my 'Trading Plan'. But, if one can't see these levels in advance like I do, it's one part of the 'Trading Plan', a critical part, that is missing, and needs to be sorted out.
I will say, as an aside, I just can't let go of the bad experience I had out in the public area. So many jumping on the bandwagon, attacking me, wondering what my agenda was. How about this for an agenda: I seem to be able to find some key levels, in advance, on a repeatable basis and I want to share this with people. If you really want the details, I want at least a token, nominal amount for the books, which took me an incredible amount of time to write.
If you look at how many hours they took me, and how many I've sold, I think I've made like $10 an hour, or less (it's just a guess, I'm not sure what it really is). So, it's likely my motivation wasn't purely financial in writing them, huh? All I ask is to at least give me my $10/hour for my effort, and then I'll show you a big chunk of what has taken me just about 40,000 hours now to develop.
But, no, they hammered me for being a shill, and decided that it isn't worth looking at my work. Now I post the levels in here, for free, they get reactions over and over and over, and I'm willing to answer questions on how this is done so anyone can try to duplicate the work. And out there, they have no clue as to what we do. And they don't want to know. And they go on hating, patrolling the forum for 'people like me', making sure they are crushed and driven out. They are very good at what they do; they've succeeded. And we will keep on posting in here, stuff that, to me, seems so good it can't even be real. I guess they won, huh?
(Let me mention that none of the above comments are meant to in any way reflect badly upon Guy, the forum owner. He's between a rock and a hard spot in situations like this, in that he has to let people express their opinions to a point, or he will be seen as too overbearing. Give people freedom, but not too much freedom. It's a tough job.
I lay all the 'blame', 100%, on the handful of 'haters' out there who have an agenda that has little to do with finding truly valuable information, even if it costs, and more about proving the point that anything of value must be free (good luck with that one...), and that anyone who disagrees, or won't acquiesce to their 'authority' in their threads on this, must be driven out.)
Posted-07/29/2011 : 02:07:00
Originally posted by jimkane
Upside levels, short-term, in case we need them, are:
94.50-95.00 (.447 is at 96.41, 1.000 ABCD at 93.50, so in there somewhere?)
98.75-99.00
1303.50-4.75
Center of the areas, as usual. And I think we may be needing them, sooner than one might think...