JA
jarek
Rep: 94
Posts: 3,474
Welcome back everybody! I just returned for a one week break between my holidays and thought it won't be bad if I share some charts Here is the update of my daily ES chart:
AL
albert
Rep: 99
Posts: 3,094
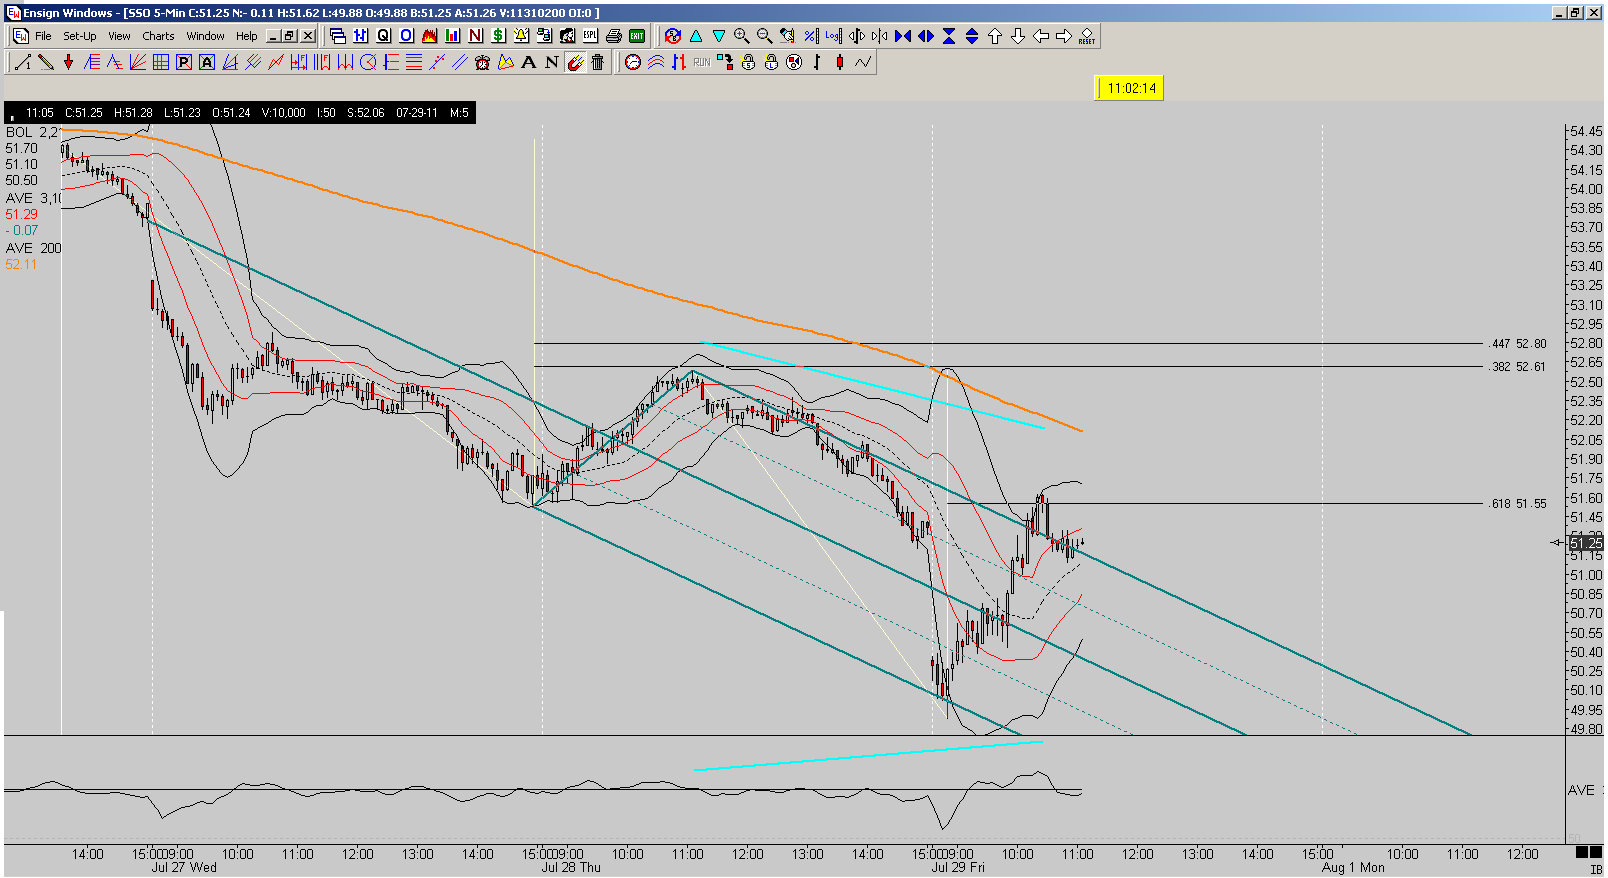
Just a Trader's Dream setup, after the fact.
Al Kamego
Al Kamego
Click image for original size
JA
jarek
Rep: 94
Posts: 3,474
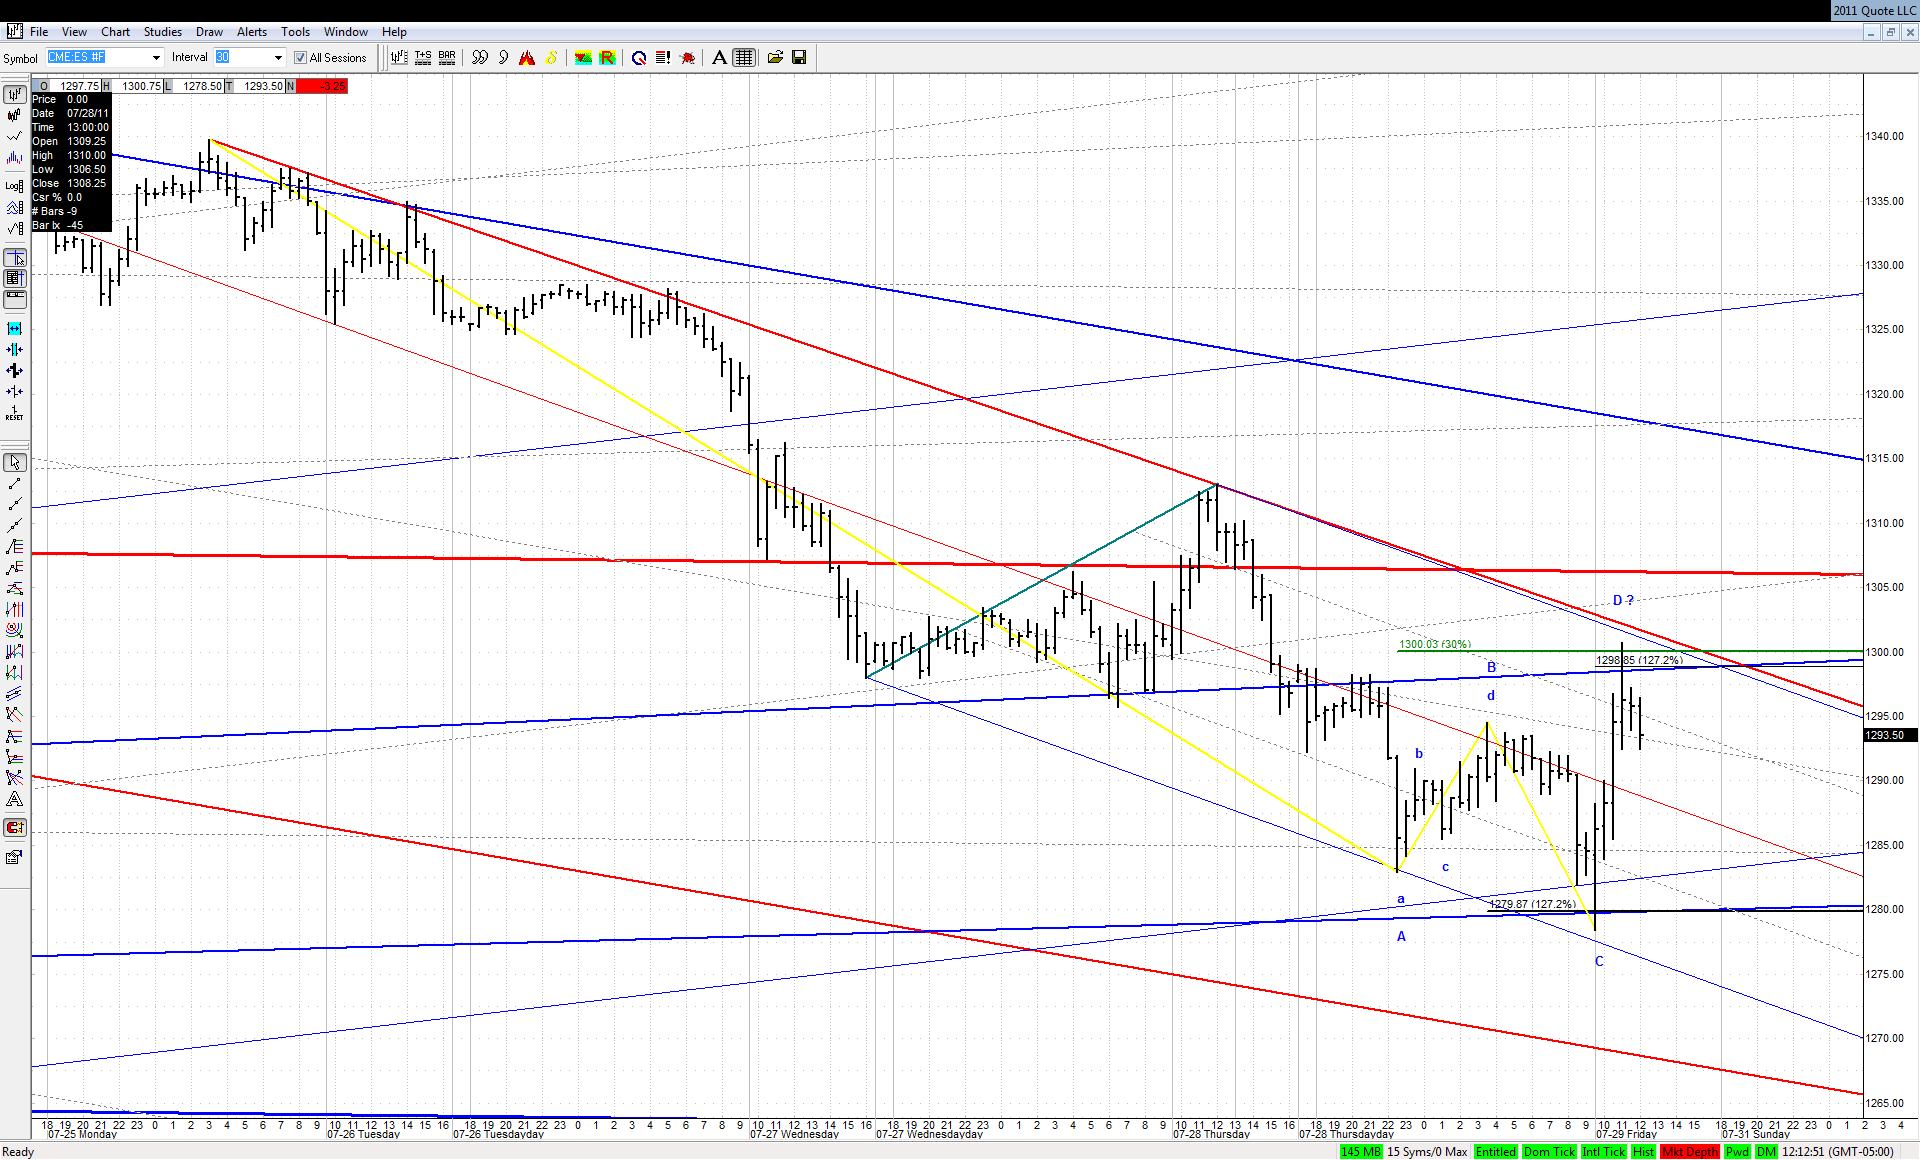
Another hurdle on the way up - this time bearish EXP:
Click image for original size
AL
albert
Rep: 99
Posts: 3,094
Originally posted by jarek
Another hurdle on the way up - this time bearish EXP:
Click image for original size
jarek,
Cool. I ran out of votes or I would have voted you up.
Al Kamego
RA
rat89
Rep: 0
Posts: 7,015
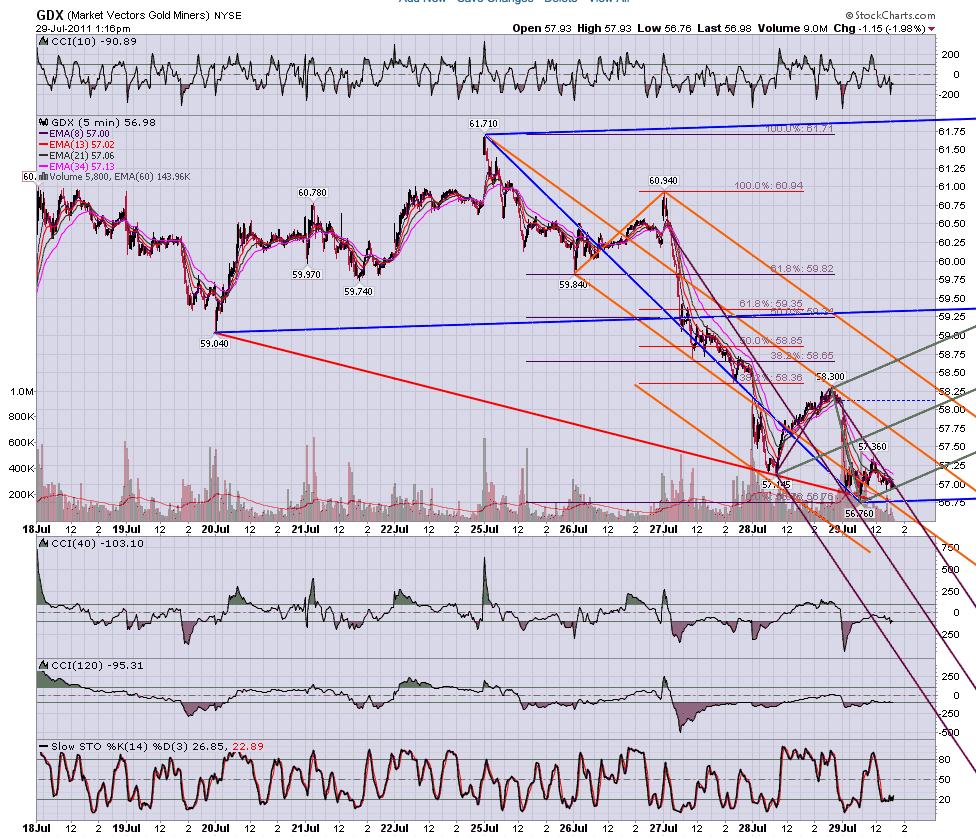
5 days of selling and here it is right in the corner with almost no volume...
Click image for original size
JI
jimkane
Rep: 3,058
Posts: 33,089
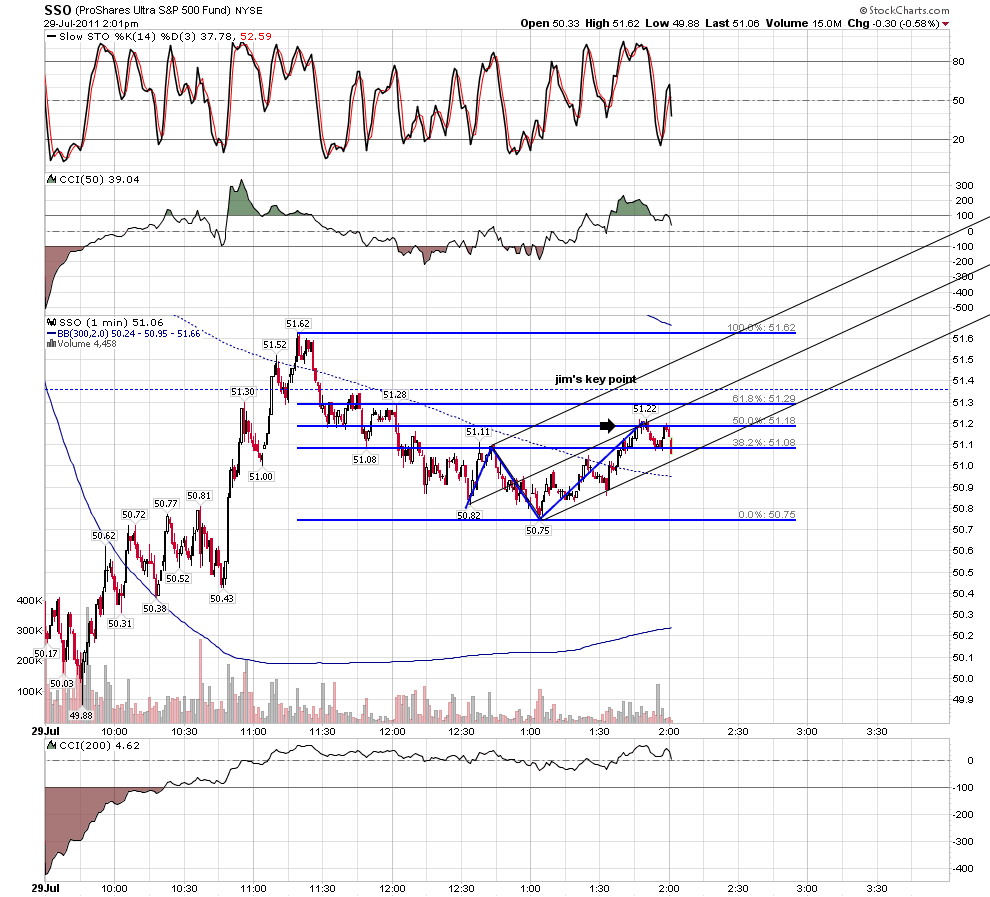
Okay, now watch the 1-min and this little bullish ABCD for early clues. Since that low was at an extremely significant spot, and it ramped over the obligatory 20+ points they like, the 'bottom' may be in, and I'm wary to expect anything but up in here. But, watch for clues. I think the clue will be any second now as it explodes up.
JI
jimkane
Rep: 3,058
Posts: 33,089
Exactly right, roofer. And you can evens see the little ABCD I mentioned in the last post.
JI
jimkane
Rep: 3,058
Posts: 33,089
Okay, we see now. Last push off a small ABCD to finish it off, or just another little dip and another leg up? If it's going to start to sell again, this could be the spot. Decision time.
JA
jarek
Rep: 94
Posts: 3,474
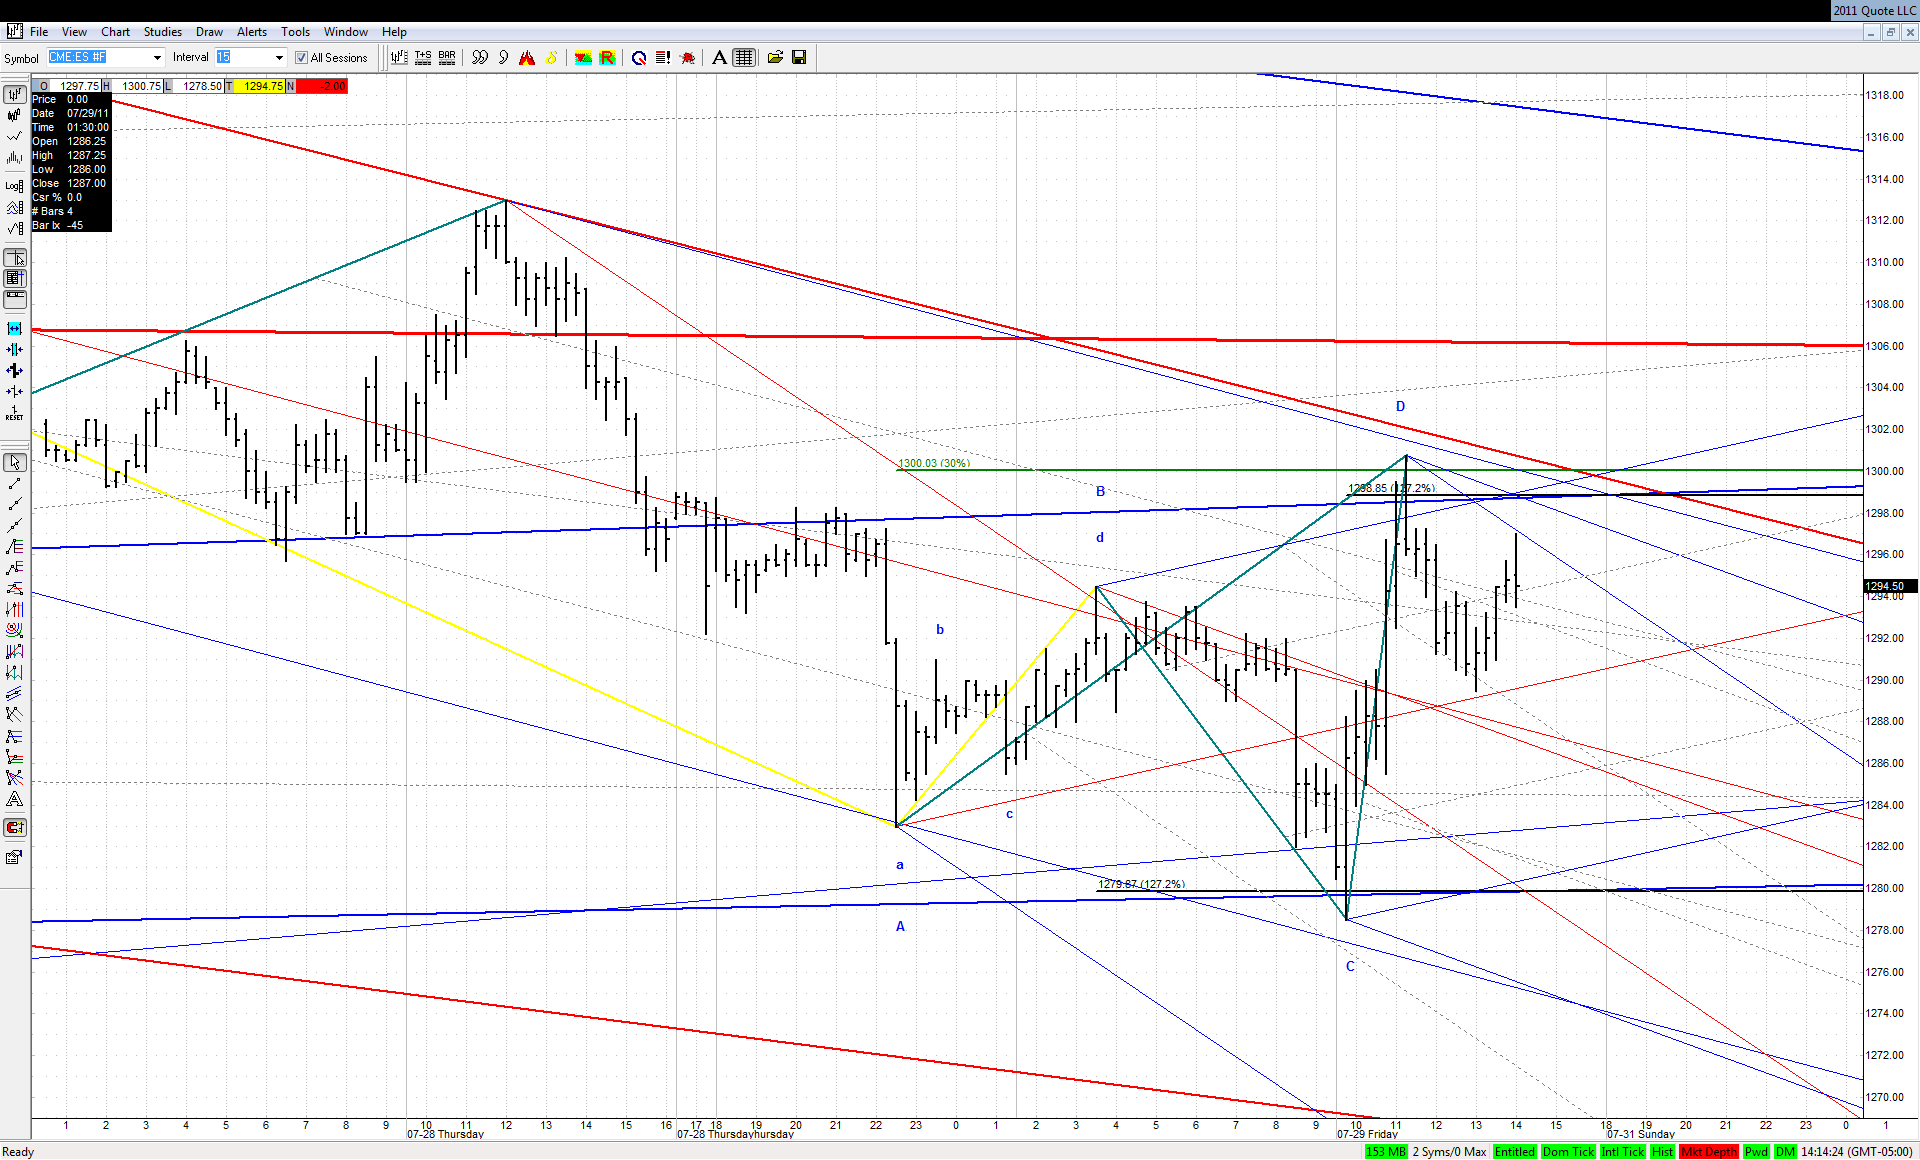
Bulls need some more effort as these still may be waves 1 and 2 of the move off the bearish EXP:
Click image for original size
JI
jimkane
Rep: 3,058
Posts: 33,089
Let's follow up on this. Go to the time shown below on your ES all-sessions chart. The ES was around 1290. It rose from there to 1294.50. Note the first level posted below. It then began to drop. It did a very typical 'W1' first move (my mentor students would know just how typical this was, but that is not necessary information for this example), a nice 'W2' pullback, and then headed back down, hitting a new low for the move at 1278.50. That was a drop of 16 points off the area posted.
Although I didn't post this because it was the middle of the night for me, my key level once this started to sell off was hit within one tick of the center of my grouping level (and the small bounce on the way down was also at an area I'd expect that from). The bounce up after of 22.25 points was right between my two most critical lines (do an obvious TL!). Just amazing, to put it mildly. So, once again, the same point. How, of all the places on the chart this could have risen to and then sold off hard from, why, again, was it one of the levels I posted (in advance, of course)?
Now, I am not saying this is a panacea, or a way to riches. Everyone who has followed me for any length of time knows I am not even hinting at that. I don't know which level, if any, this will respect. I have to have an idea what I think will happen so that I know where I may trade, and on what side. This takes experience. And as I've said, the setup is only 10%-20% of my 'Trading Plan'. But, if one can't see these levels in advance like I do, it's one part of the 'Trading Plan', a critical part, that is missing, and needs to be sorted out.
I will say, as an aside, I just can't let go of the bad experience I had out in the public area. So many jumping on the bandwagon, attacking me, wondering what my agenda was. How about this for an agenda: I seem to be able to find some key levels, in advance, on a repeatable basis and I want to share this with people. If you really want the details, I want at least a token, nominal amount for the books, which took me an incredible amount of time to write.
If you look at how many hours they took me, and how many I've sold, I think I've made like $10 an hour, or less (it's just a guess, I'm not sure what it really is). So, it's likely my motivation wasn't purely financial in writing them, huh? All I ask is to at least give me my $10/hour for my effort, and then I'll show you a big chunk of what has taken me just about 40,000 hours now to develop.
But, no, they hammered me for being a shill, and decided that it isn't worth looking at my work. Now I post the levels in here, for free, they get reactions over and over and over, and I'm willing to answer questions on how this is done so anyone can try to duplicate the work. And out there, they have no clue as to what we do. And they don't want to know. And they go on hating, patrolling the forum for 'people like me', making sure they are crushed and driven out. They are very good at what they do; they've succeeded. And we will keep on posting in here, stuff that, to me, seems so good it can't even be real. I guess they won, huh?
(Let me mention that none of the above comments are meant to in any way reflect badly upon Guy, the forum owner. He's between a rock and a hard spot in situations like this, in that he has to let people express their opinions to a point, or he will be seen as too overbearing. Give people freedom, but not too much freedom. It's a tough job.
I lay all the 'blame', 100%, on the handful of 'haters' out there who have an agenda that has little to do with finding truly valuable information, even if it costs, and more about proving the point that anything of value must be free (good luck with that one...), and that anyone who disagrees, or won't acquiesce to their 'authority' in their threads on this, must be driven out.)
Posted-07/29/2011 : 02:07:00
Originally posted by jimkane
Upside levels, short-term, in case we need them, are:
94.50-95.00 (.447 is at 96.41, 1.000 ABCD at 93.50, so in there somewhere?)
98.75-99.00
1303.50-4.75
Center of the areas, as usual. And I think we may be needing them, sooner than one might think...