ES Fri 8-5-11
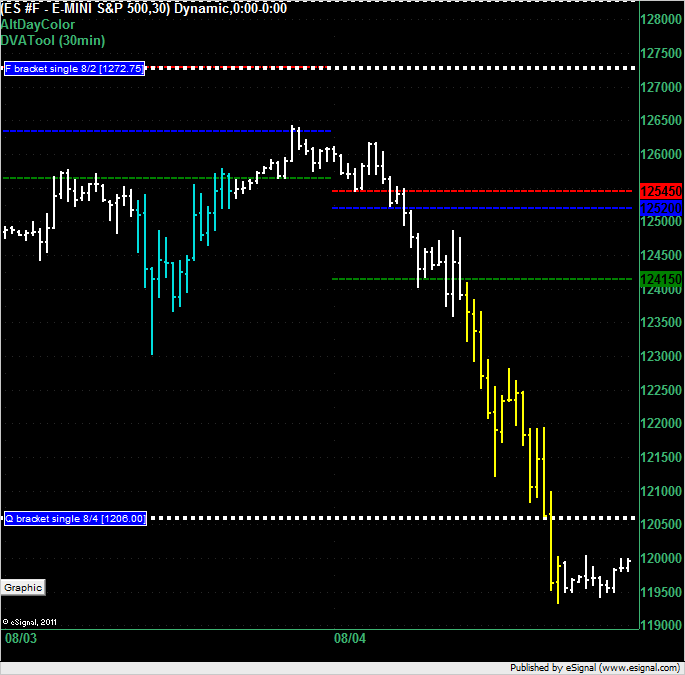
On Thursday the market opened below the value area and never returned to it so not giving the Market Profile trader a chance to get short from the VAL. Considering the size of the down day we had today I'm surprised that we only got one single print out of it in the Q bracket at 1206 even.
Click image for original size
there is a rumor circulating around wall street dealers that s&p will downgrade the US after the close today
take as what it is, a rumor, but since i heard it market has gone completely crazy and jumpy
take as what it is, a rumor, but since i heard it market has gone completely crazy and jumpy
the 88.25 was almost exceeded by 3 pts, so do you look at the projection using 202.75 as bottom instead of 207.25 ?
Originally posted by prestwickdrive
Originally posted by prestwickdrive
Originally posted by ayn
prestwickdrive, if you are around, how would you treat that 1min bar that spiked down before the 8:30 data and then obviously moved up leaving a gap in data in between
do you take the low and high of that red bar prior to 8:30 (that is 1191.75 - 1202.25) ? if so, the market stopped right at its full projection of 219.25
thank you
ayn,
I am using two sets of projections off the jobs number. On the upside the move from 1191.75-1219.0 gives an initial projection of 1236.0 and a full of 1263.25. The retrace off of 1219.0 to 1207.25 gives an initial projection of 1200.00 and a full of 1188.25. A touch of 1191.75 negates the up projection and a touch of 1219 negates the down one.
1263.25 and 1236.0 projections failed on touch of 1191.75. 1188.25 projection hit
Originally posted by ayn
the 88.25 was almost exceeded by 3 pts, so do you look at the projection using 202.75 as bottom instead of 207.25 ?
Originally posted by prestwickdrive
Originally posted by prestwickdrive
Originally posted by ayn
prestwickdrive, if you are around, how would you treat that 1min bar that spiked down before the 8:30 data and then obviously moved up leaving a gap in data in between
do you take the low and high of that red bar prior to 8:30 (that is 1191.75 - 1202.25) ? if so, the market stopped right at its full projection of 219.25
thank you
ayn,
I am using two sets of projections off the jobs number. On the upside the move from 1191.75-1219.0 gives an initial projection of 1236.0 and a full of 1263.25. The retrace off of 1219.0 to 1207.25 gives an initial projection of 1200.00 and a full of 1188.25. A touch of 1191.75 negates the up projection and a touch of 1219 negates the down one.
1263.25 and 1236.0 projections failed on touch of 1191.75. 1188.25 projection hit
Once that projection got exceeded I looked at the next cycle low off the high. That was 1219-1202.75 giving an initial of 1192.75 that hit and a full of 1176.5 that is valid until 1219 is taken out. Off the cycle low of 1283.0 I used the move to 1190.25 giving an an initial of 1194.75 and a full of 1202.0 which both hit.
I am primarily trading crude oil and using the ES as a clue for CL direction so I am going to have to cut back on posts here as I am missing some good trades. Happy trading to all and have a great weekend.
thanks for your help and good luck !
Originally posted by prestwickdrive
Originally posted by ayn
the 88.25 was almost exceeded by 3 pts, so do you look at the projection using 202.75 as bottom instead of 207.25 ?
Originally posted by prestwickdrive
Originally posted by prestwickdrive
Originally posted by ayn
prestwickdrive, if you are around, how would you treat that 1min bar that spiked down before the 8:30 data and then obviously moved up leaving a gap in data in between
do you take the low and high of that red bar prior to 8:30 (that is 1191.75 - 1202.25) ? if so, the market stopped right at its full projection of 219.25
thank you
ayn,
I am using two sets of projections off the jobs number. On the upside the move from 1191.75-1219.0 gives an initial projection of 1236.0 and a full of 1263.25. The retrace off of 1219.0 to 1207.25 gives an initial projection of 1200.00 and a full of 1188.25. A touch of 1191.75 negates the up projection and a touch of 1219 negates the down one.
1263.25 and 1236.0 projections failed on touch of 1191.75. 1188.25 projection hit
Once that projection got exceeded I looked at the next cycle low off the high. That was 1219-1202.75 giving an initial of 1192.75 that hit and a full of 1176.5 that is valid until 1219 is taken out. Off the cycle low of 1283.0 I used the move to 1190.25 giving an an initial of 1194.75 and a full of 1202.0 which both hit.
I am primarily trading crude oil and using the ES as a clue for CL direction so I am going to have to cut back on posts here as I am missing some good trades. Happy trading to all and have a great weekend.
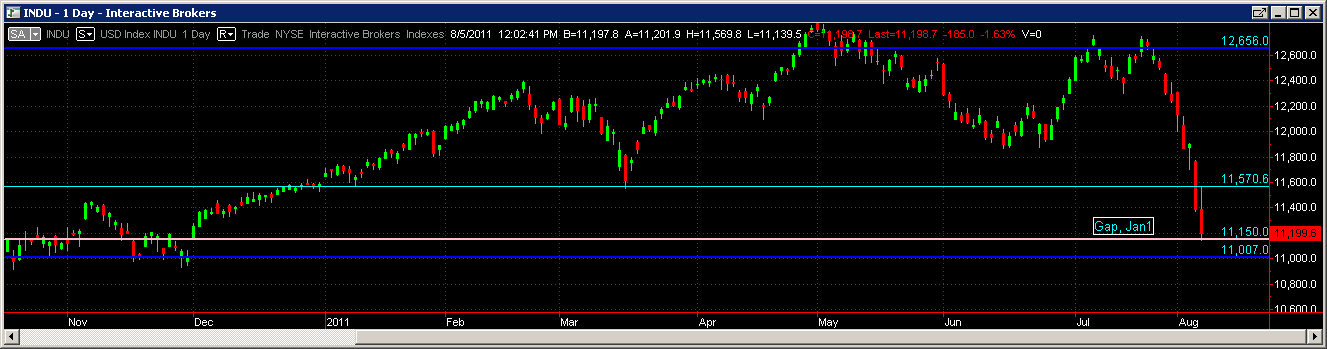
We just hit 11, 150 on INDU
Click image for original size
ECB boys must be AWOL, on vacation. To be so far behinds the curve....
Italian PM is giving a press-conference. What is Italian for "do not worry"? lol
oh, yeah, "forget about it"...
ECB will buy Spanisha nd Italian bonds if Berlusconi promises cutbacks. He is scheduled to speak in 25 min
Downgrade or no downgrade, the status quo is deplorable indeed... in the USA, Europe, Japan... a downgrade at this point is just a symbolic kick in the leg.
Emini Day Trading /
Daily Notes /
Forecast /
Economic Events /
Search /
Terms and Conditions /
Disclaimer /
Books /
Online Books /
Site Map /
Contact /
Privacy Policy /
Links /
About /
Day Trading Forum /
Investment Calculators /
Pivot Point Calculator /
Market Profile Generator /
Fibonacci Calculator /
Mailing List /
Advertise Here /
Articles /
Financial Terms /
Brokers /
Software /
Holidays /
Stock Split Calendar /
Mortgage Calculator /
Donate
Copyright © 2004-2023, MyPivots. All rights reserved.
Copyright © 2004-2023, MyPivots. All rights reserved.