ES Friday 9-30-11
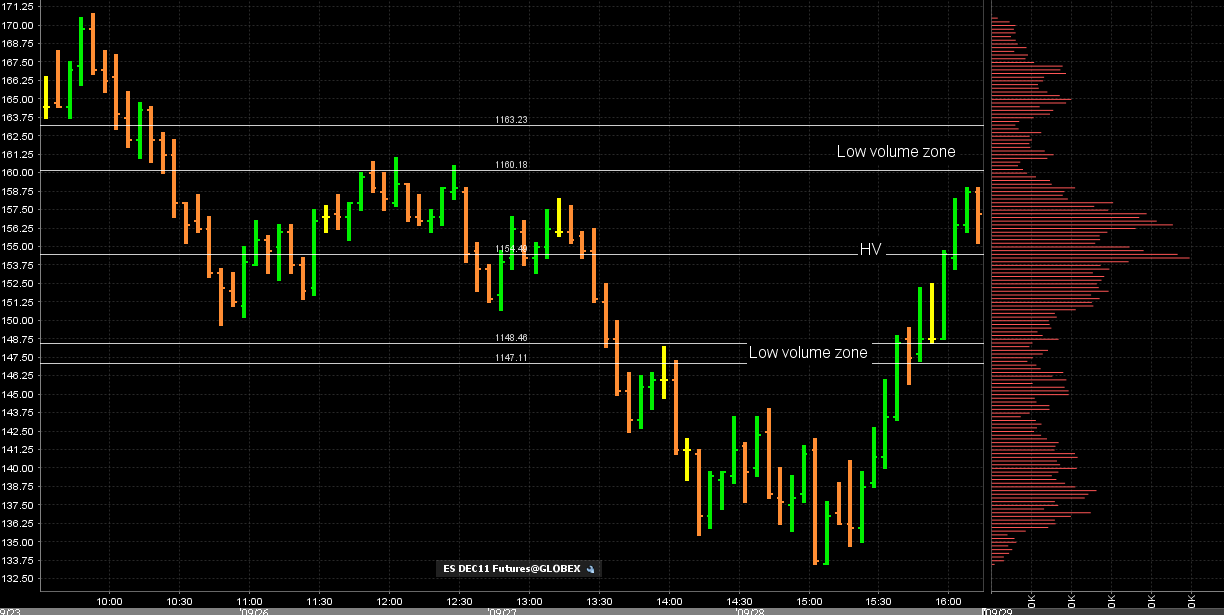
Lets at least start with the correct date.....Hopefully we can do as well with this chart as yesterday. I'm just posting it now but will elaborate more in the morning. The main bell curve has peak volume at
1154.25 . The low volume above that is a zone in the 1160.50 - 1163 and the low volume below is 1147 - 1148.50. Once again turn it on it's side if you can't see it.
We also have a secondary low volume zone at 1143 - 1144 and then another high volume spot at 1138.25. I'm not marking those on the chart right now just to keep the chart cleaner and a better visual. We'll expand on this in the morning When we see what the overnight does.
Click image for original size
Originally posted by BruceM
Lets at least start with the correct date.....Hopefully we can do as well with this chart as yesterday. I'm just posting it now but will elaborate more in the morning. The main bell curve has peak volume at
1154.25 . The low volume above that is a zone in the 1160.50 - 1163 and the low volume below is 1147 - 1148.50. Once again turn it on it's side if you can't see it.
We also have a secondary low volume zone at 1143 - 1144 and then another high volume spot at 1138.25. I'm not marking those on the chart right now just to keep the chart cleaner and a better visual. We'll expand on this in the morning When we see what the overnight does.
Click image for original size
WITH A SINGLE PRINT AT 63.75, CORRECT?
single print is at 63.50.
Also we have the Vah high at 61 and Va low at 42...u will find the numbers match up well when the profile is symetric like yesterdays.
Based on the overnight action I like the sells up at the 47 - 48 area. Since the current overnight low matches up near the 38 high volume number then it become ok for me to look for buys in that area. I normaly wouldn't look for buys in a high volume area as a stand alone trade. It needs something else to line up for me to take that trade.
Deep in the back of my mind I "know " that yesterdays volume ended symetric and we have the daily pivot at 53.50...so that high volume at 54 area becomes a big attractor especially with the daily pivot there.
The point is that we need to stay nimble. If we get the chance to sell the 47 - 48 then we need to watch very closely as the trade could go upside down on us fast and we would have to then get long for that pivot retest...hope that makes sense..
S1 is down at 36.50 so that also wil help with our 38 long number..if it comes. Gonna need to let the overnight play out a bit more to formulate a more concrete plan.
If we open in value the the value area players will try to buy in the 42 number..I will pass on that unless we can push down below that a bit more....like the 38...
Something to add to Bruce's thoughts:
Weekly RTH Open is 1140.25. This isn't a LVN but I think its extremely important to watch. Prices rallied from this area yesterday. So remember the old saying, what was once support can become resistance...meaning this could be the dividing line between bull/bear.
Weekly RTH Open is 1140.25. This isn't a LVN but I think its extremely important to watch. Prices rallied from this area yesterday. So remember the old saying, what was once support can become resistance...meaning this could be the dividing line between bull/bear.
Ideal trade for me now is to buy under the 38 number.....below the overnight lows ...but the best long idea that I have is to buy under yesterdays RTH lows down near the 30.50 low volumne number....sells for me will come near 47 - 48....reports today too...
Here is the O/N volume profile. Interesting that it sports the b shape, opposite from yesterday's p shape.
Click image for original size
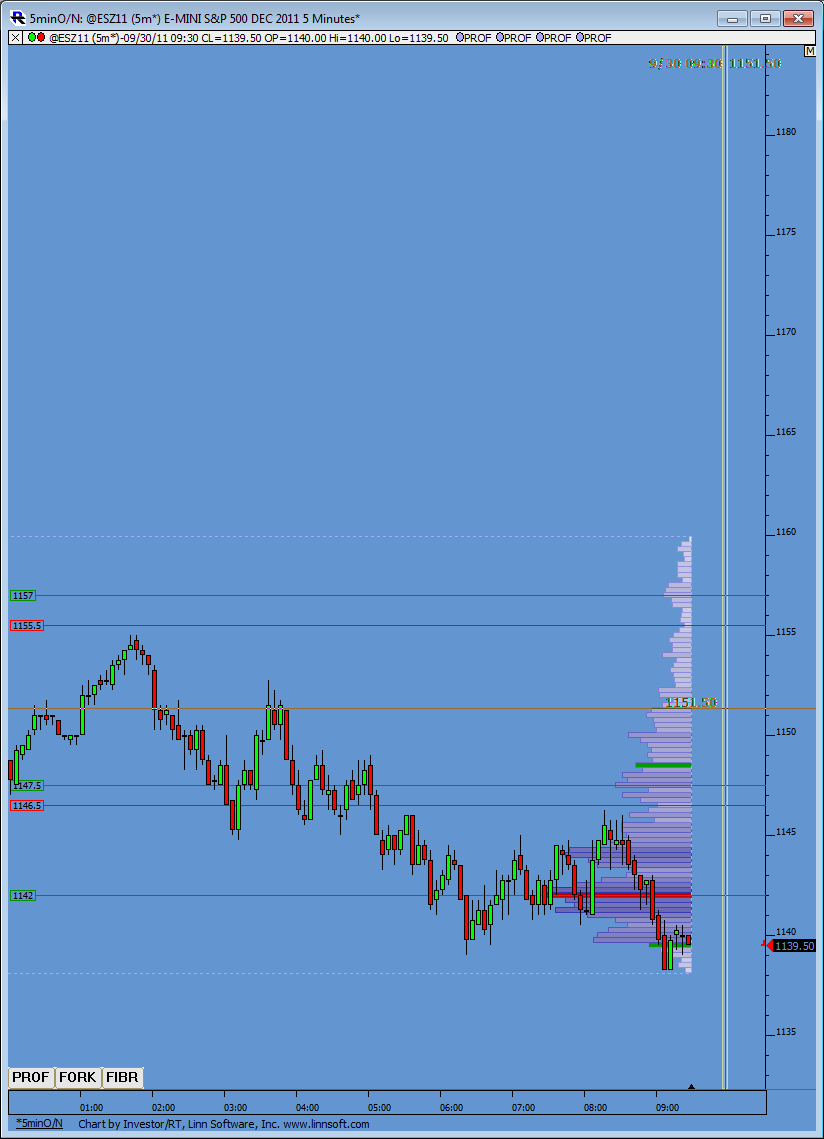
peak volume from the overnight is right at that 42 va low so I donot like using that number to initiate from.....but a target is ok
patience...I really need this to under yesterdays low......to set up th elong fade for the 38 retest first.....report in 8 minute...hate those
chic pmi is released to some at 9:42 am so that is where you will see the initial reaction....official number out at 9:45
well sticking to my guns on 33. and then 27.to 30 IF WE GET THERE
Originally posted by sandoxe
Is a tuff trade bc is against the trend. That's why my stop is very close. Worth a shot!
ES tested the support 1133.50 and went under it, now testing it as resistance and here we go! Long at 1133.50. stop below the just made low 1131.75 at 1131.50.
will see.
ES trading 1134.25 @ 14:54 E.T.
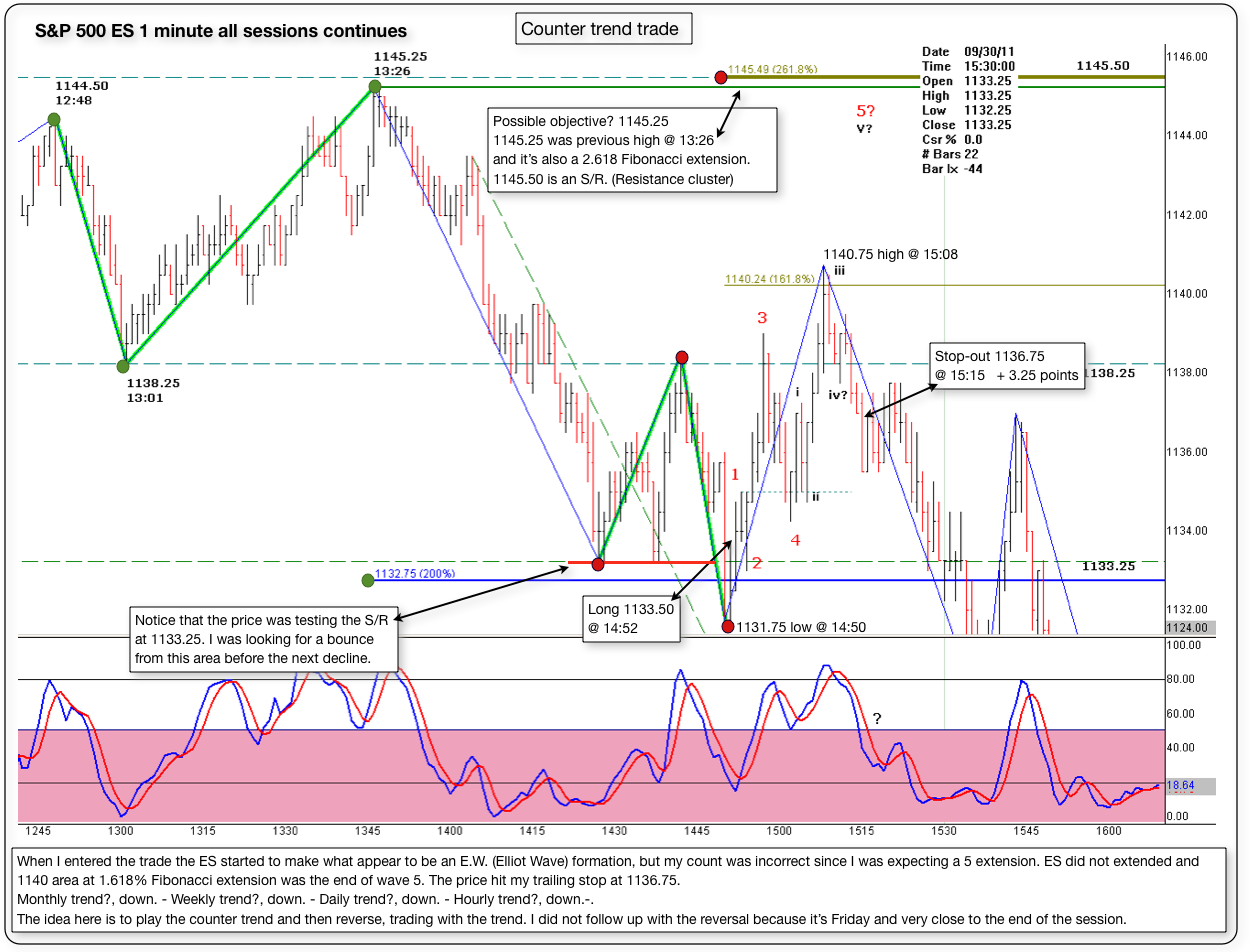
Below is a 1 minute chart with some comments about the counter trend trade posted late Friday.
When I entered the trade the ES started to make what appear to be an E.W. (Elliot Wave) formation, but my count was incorrect since I was expecting a 5 wave extension. ES did not extended and 1140 area at 1.618% Fibonacci extension was the end of wave 5. The price hit my trailing stop at 1136.75.
The idea here is to play the counter trend and then reverse, trading with the trend. I did not follow up with the reversal because it’s Friday and very close to the end of the session.
Click image for original size
Emini Day Trading /
Daily Notes /
Forecast /
Economic Events /
Search /
Terms and Conditions /
Disclaimer /
Books /
Online Books /
Site Map /
Contact /
Privacy Policy /
Links /
About /
Day Trading Forum /
Investment Calculators /
Pivot Point Calculator /
Market Profile Generator /
Fibonacci Calculator /
Mailing List /
Advertise Here /
Articles /
Financial Terms /
Brokers /
Software /
Holidays /
Stock Split Calendar /
Mortgage Calculator /
Donate
Copyright © 2004-2023, MyPivots. All rights reserved.
Copyright © 2004-2023, MyPivots. All rights reserved.