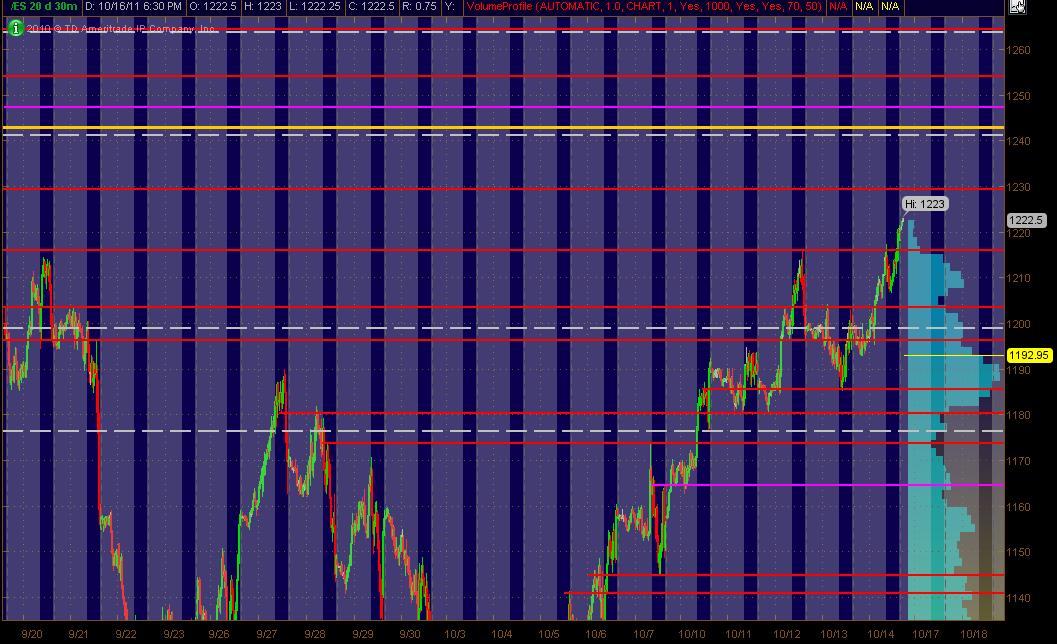
Here's what I've got in the way of a MAP for the ES coming into Monday's trading and the week. The Red Lines are potential significant PASR levels with any Magenta Lines as "semi" significant levels. White Dashed Lines are Wkly Pivots as per mypivots site. The Yellow line above the current market is a significant Fib Cluster fwiw.
The right vertical lighter Blue reflects 20 days of All Trading Hours Volume Profile. The Grayed out background is the non-RTH price activity. Hope this his helpful for some ... especially when incorporated with shorter term Volume Profile of the past 1 to several days ... looking at bell curves and more importantly, the High Volume Areas ... and the Low Volume Areas.
BR
BruceM
Rep: 216,211
Posts: 19,895
they are doing just what they are suppose to do with the 08.50 low volume....very best trade would be and hour break down intothe 04- 05 number to look for buys....not sure if LORN is gonna let that happen for us today!!
BR
BruceM
Rep: 216,211
Posts: 19,895
$ticks just don't want to go minus 1000 yet...c'mon where is our ultimate buy zone.....lets have it already..
LI
Lisa P
Rep: 6,498
Posts: 1,428
Originally posted by PAUL9
Is this thing going to bounce at a print of 1206.75 (maybe one tick below)?
thanks for all the dentistry advice.
Paule, I hope so. We had a long "measured move" (2 legs) into support and Wednesday's VPOC. I would hate to take a "break-down" trade here, though below is a low-volume area (as per my MP chart above). I am going to stand down this one
BR
BruceM
Rep: 216,211
Posts: 19,895
efficient selling..all air pockets are filled....we need the big down push and leave some air behind...2 minutes and hour is up....c'mon..push it lower...