ES Friday 12-9-11
Yesterday the ES formed a Trend Day pattern on the market profile
As expected, this morning trade has bounced back into yesterday's range
We have a gap fill at 1230.25 (March 2012 contract)
50% of yesterday's wide range (41 ES points) is 1245.50
(below that level trend bias remains short)
As expected, this morning trade has bounced back into yesterday's range
We have a gap fill at 1230.25 (March 2012 contract)
50% of yesterday's wide range (41 ES points) is 1245.50
(below that level trend bias remains short)
they want 1252 looks like
triing to come in to first hour
something I have had on my monitor for about 4 years:
"The best trends happen when we trade outside of BOTH the overnight range and the previous days range early in the day"
This makes sense as all the main immediate reference points that many of us day traders focus on are not available after they break and hold above/below BOTH of those ranges...
Today is still an inside day...so we can still fade !!
for those who don't like time you can use a price differential to compare key areas from the expired contract with the current contract. It's not perfect but as of yesterdays close the March 12 was trading about 6 points less than december...so we can use a 5 - 7 point differential range....
we had 56 as a big area on December 2011 contract....see yesterdays chart...so that equates to to 49 - 51 on March.....!!
we had 56 as a big area on December 2011 contract....see yesterdays chart...so that equates to to 49 - 51 on March.....!!
Just to play devils advocate I want to say that the POC for today was at one time down at 1241...then it jumped UP to 46.25...so now most of the volume is under todays POC but BOTH of these values are ABOVE yesterdays POC...which implies bullishness...( higher value than yesterday)
This doesn't mean who should stop fading our predefined areas but we need to be aware of what is happening on a higher time frame!!
This doesn't mean who should stop fading our predefined areas but we need to be aware of what is happening on a higher time frame!!
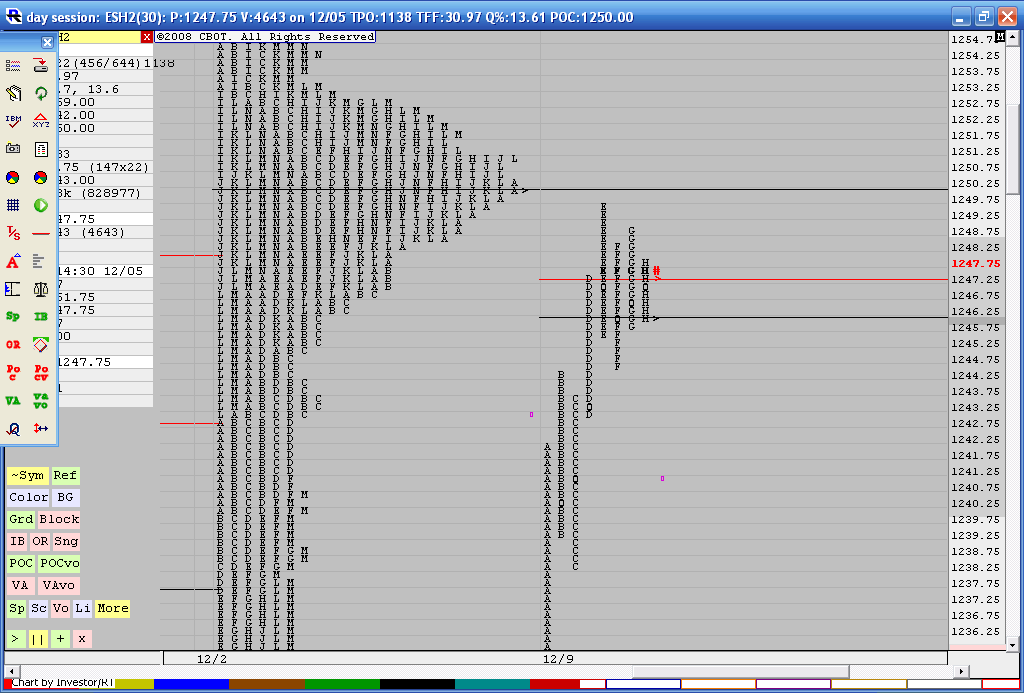
here is how we are looking today up against a merged profile from this week. Merged only to show the high TPO concentration with a peak node of 1250 !
The daily profile seems to be making a "P" profile which in theory only implies a short covering rally and not fresh longs entering the market. The only thing we can be sure of right now is that is seems that price is struggling up here to go higher. If I had been long from lower prices I probably would want to take profits ahead of that TPO node too.
The daily profile seems to be making a "P" profile which in theory only implies a short covering rally and not fresh longs entering the market. The only thing we can be sure of right now is that is seems that price is struggling up here to go higher. If I had been long from lower prices I probably would want to take profits ahead of that TPO node too.
Click image for original size
lots of conflict here and it's Friday. Can't find any great reason to take a trade. Earlier I was selling as we had single prints below and they tried to get the SECOND set of single prints to form....a key trade for me for those who know my setups...having that big tpo node was a benefit earlier. Now I am not so sure!
Do we assume that we are underneath that high TPO node so price is being accepted lower still or do we assume that we are consolidating above the hour breakout from today and we will have higher trade into days end? many times the day session will confirm the longer term work. This doesn't seem like one of those clear cut days to me.
Do we assume that we are underneath that high TPO node so price is being accepted lower still or do we assume that we are consolidating above the hour breakout from today and we will have higher trade into days end? many times the day session will confirm the longer term work. This doesn't seem like one of those clear cut days to me.
200MA like a brick wall
Click image for original size
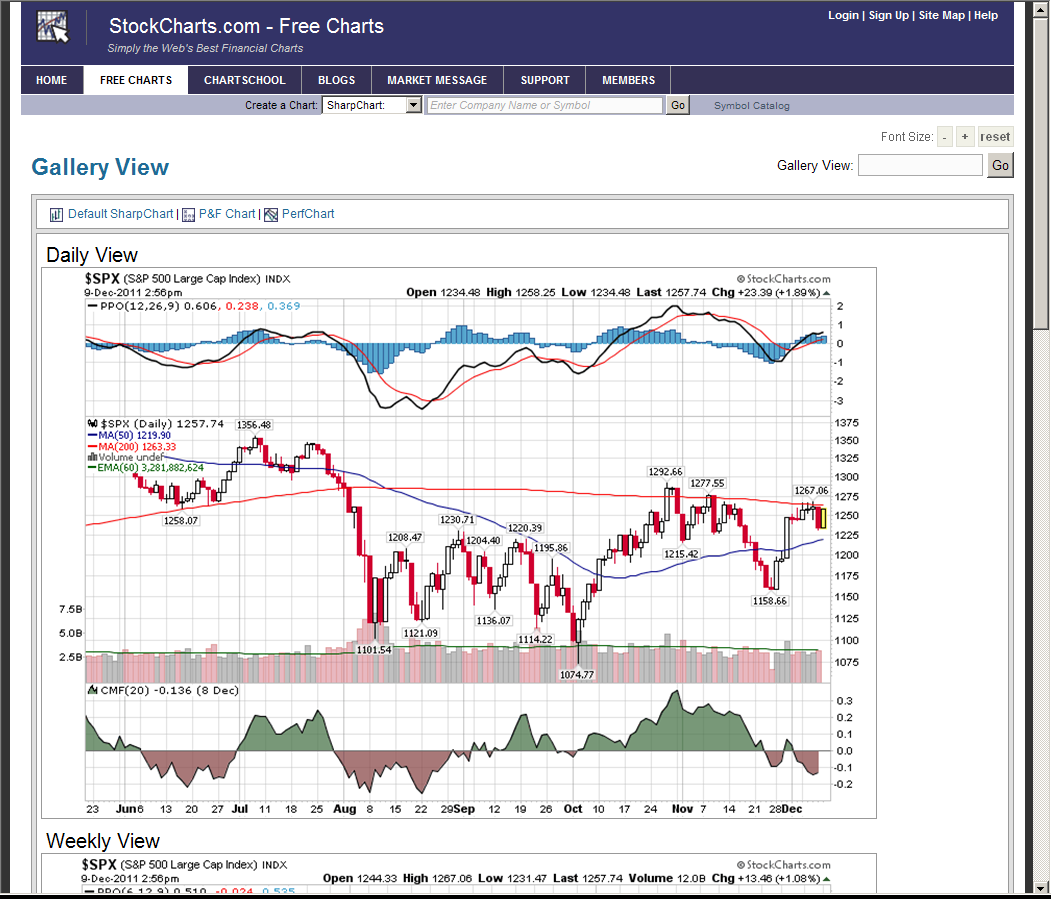
your cash charts bring up an interesting point:
If so many look at the cash markets then why all this fuss about the overnight sessions? We would be wise to stick with our real time day session only charts and use the overnight just to confirm our areas on our day session charts above and below the market.
Thanks Lisa!
If so many look at the cash markets then why all this fuss about the overnight sessions? We would be wise to stick with our real time day session only charts and use the overnight just to confirm our areas on our day session charts above and below the market.
Thanks Lisa!
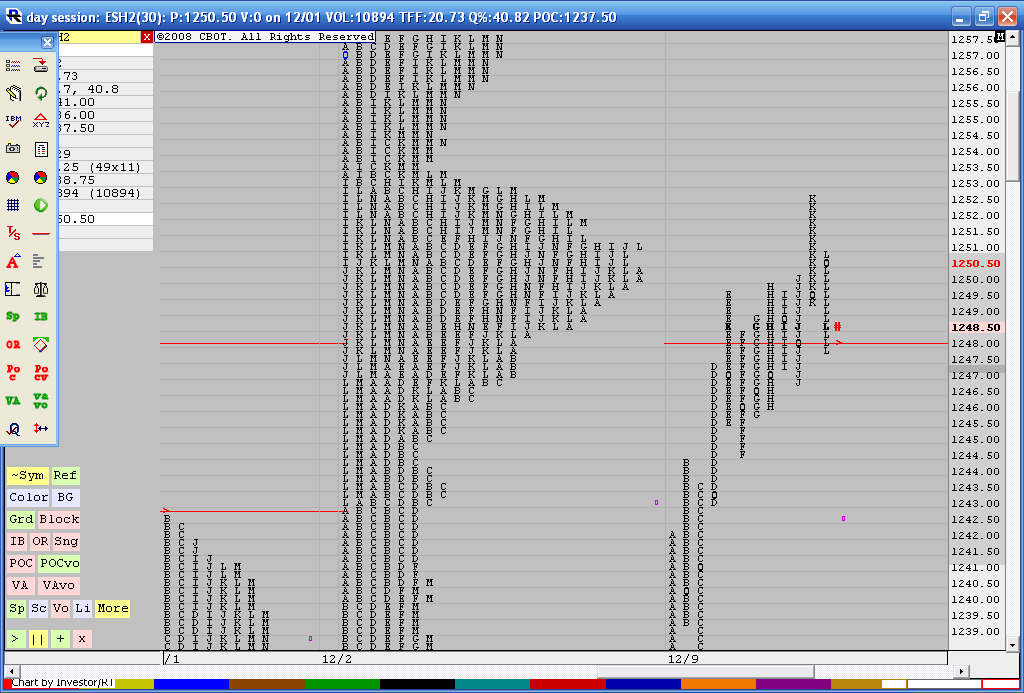
here is an update: Ideally a volume trader would want to see the peak volume price ( the red line) get above the 1250 number in an attempt to generate volume at higher prices....
Click image for original size
Thanks to all. Have a good weekend
Emini Day Trading /
Daily Notes /
Forecast /
Economic Events /
Search /
Terms and Conditions /
Disclaimer /
Books /
Online Books /
Site Map /
Contact /
Privacy Policy /
Links /
About /
Day Trading Forum /
Investment Calculators /
Pivot Point Calculator /
Market Profile Generator /
Fibonacci Calculator /
Mailing List /
Advertise Here /
Articles /
Financial Terms /
Brokers /
Software /
Holidays /
Stock Split Calendar /
Mortgage Calculator /
Donate
Copyright © 2004-2023, MyPivots. All rights reserved.
Copyright © 2004-2023, MyPivots. All rights reserved.