ES Tuesday 12-13-11
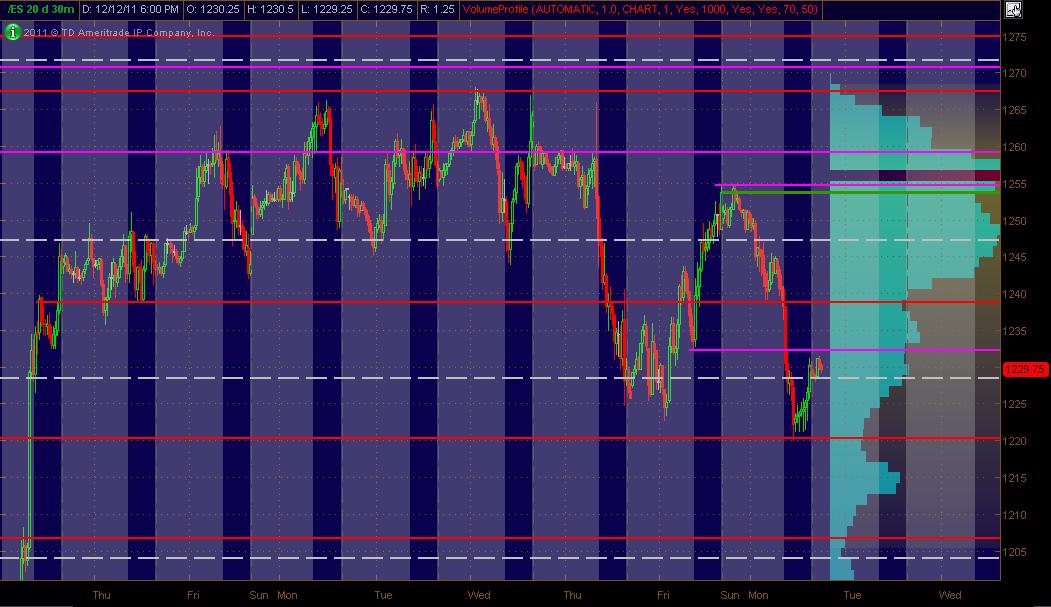
Here's what I've got for my ES MAP of PASR ZONES using a 30min chart of 20 days of data coming into Tuesday's trading. The Red lines are potential significant levels with Magenta lines as semi-significant. The White dashed lines are the Weekly Pivots. The Green line is an unclosed gap level. The Light Blue Volume Profile of the past "rolling" 20 days is displayed on the right vertical axis. The Gray background shows non-RTH price activity. Hope, as always, that this is helpful to some as a "MAP."
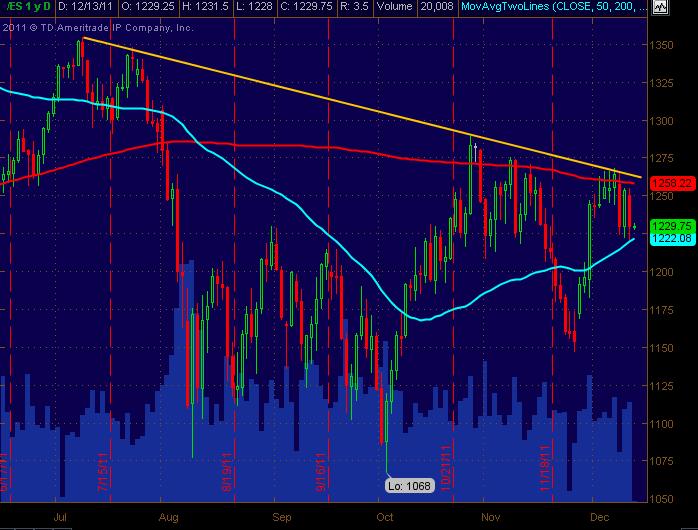
And here's the All Trading Hours Daily (continuous contract) for the ES. We've had some WR days with the 200sma and 50sma containing price as they're converging, fwiw ... with the Yellow down trend line still intact. Just a bigger view to combine visually with the 30min PASR chart for better analysis.
MM
Click image for original size
And here's the All Trading Hours Daily (continuous contract) for the ES. We've had some WR days with the 200sma and 50sma containing price as they're converging, fwiw ... with the Yellow down trend line still intact. Just a bigger view to combine visually with the 30min PASR chart for better analysis.
Click image for original size
MM
hard to develop bias these days
air formed as we went through the low vol zone in the 35-36 area so tried longs in the 33.5 area and playing for a retest of that zone, taking stuff off at 35.25, the bottom of that area (which bruce also mentioned this morning)...two runners, one aiming for 36.25 (bottom of OR and potential single print level) the other for 38 (just below yest high and near o/n high)
both runners stopped at b/e
Originally posted by NickP
air formed as we went through the low vol zone in the 35-36 area so tried longs in the 33.5 area and playing for a retest of that zone, taking stuff off at 35.25, the bottom of that area (which bruce also mentioned this morning)...two runners, one aiming for 36.25 (bottom of OR and potential single print level) the other for 38 (just below yest high and near o/n high)
second trade for me is longs as that second single print is trying to form under 32.25...should go back to 90 minute low at least..
My foot prints still show selling in here 32.00area
VOlume
Click image for original size

you will ALWAYS see double tpo's at either a 30, 60 or 90 minute low/high..except when the 30 minute bars form inside the IB range...sometime during the day...what we don't know is which one of these will it definately happen and when....so buying under the 90 minute low is smart as we will see double tpos at the ranges above sometime today....
so ask yourself...have there been two seperate tpo's printing beyond and touch the 30 minute range....NO...how about touching the 60 or 90 minute range extremes??
but it will happen to one of those ranges today if not more...so buying under the 90 minute range had to be done...!!!
EDITED for clarity ...ha!!
but it will happen to one of those ranges today if not more...so buying under the 90 minute range had to be done...!!!
EDITED for clarity ...ha!!
Crazy today
Click image for original size
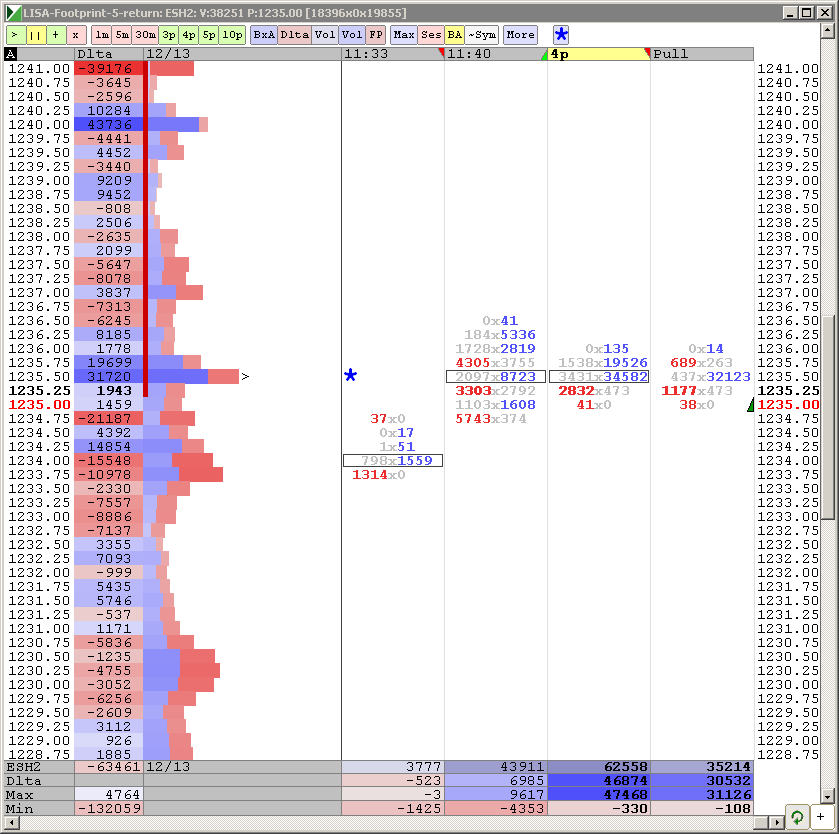
35,500 contracts traded (blue) at 1235
Gap is getting slowly filled...lookin at 1200 range....wednesday?
Emini Day Trading /
Daily Notes /
Forecast /
Economic Events /
Search /
Terms and Conditions /
Disclaimer /
Books /
Online Books /
Site Map /
Contact /
Privacy Policy /
Links /
About /
Day Trading Forum /
Investment Calculators /
Pivot Point Calculator /
Market Profile Generator /
Fibonacci Calculator /
Mailing List /
Advertise Here /
Articles /
Financial Terms /
Brokers /
Software /
Holidays /
Stock Split Calendar /
Mortgage Calculator /
Donate
Copyright © 2004-2023, MyPivots. All rights reserved.
Copyright © 2004-2023, MyPivots. All rights reserved.