ES Tuesday 12-13-11
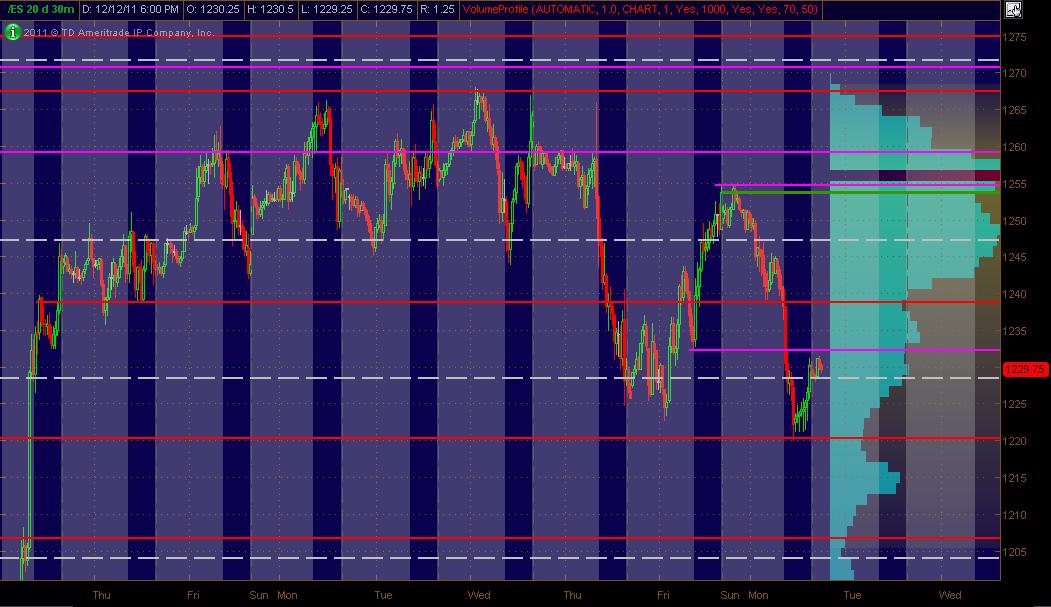
Here's what I've got for my ES MAP of PASR ZONES using a 30min chart of 20 days of data coming into Tuesday's trading. The Red lines are potential significant levels with Magenta lines as semi-significant. The White dashed lines are the Weekly Pivots. The Green line is an unclosed gap level. The Light Blue Volume Profile of the past "rolling" 20 days is displayed on the right vertical axis. The Gray background shows non-RTH price activity. Hope, as always, that this is helpful to some as a "MAP."
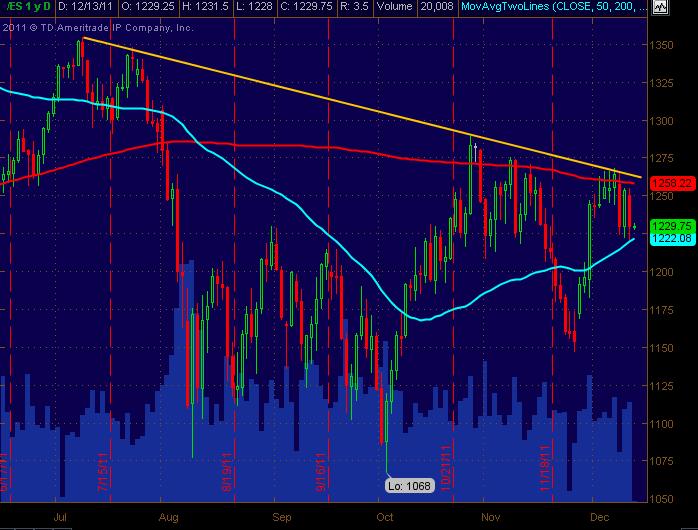
And here's the All Trading Hours Daily (continuous contract) for the ES. We've had some WR days with the 200sma and 50sma containing price as they're converging, fwiw ... with the Yellow down trend line still intact. Just a bigger view to combine visually with the 30min PASR chart for better analysis.
MM
Click image for original size
And here's the All Trading Hours Daily (continuous contract) for the ES. We've had some WR days with the 200sma and 50sma containing price as they're converging, fwiw ... with the Yellow down trend line still intact. Just a bigger view to combine visually with the 30min PASR chart for better analysis.
Click image for original size
MM
Just to point out some levels here:
1262-63 Daily Trendline Down
1258 200 Day SMA
1246-47 Wkly Pvt / Fib Retracement
1238-39 Daily R1 (RTH Calcs.) / PASR / 1-2 Day VolProf Low Volume area and 20 day rollin VolProf Low Volume area / Fib Retracement
1220-22 Daily S1 / 50 Day SMA / PASR
1262-63 Daily Trendline Down
1258 200 Day SMA
1246-47 Wkly Pvt / Fib Retracement
1238-39 Daily R1 (RTH Calcs.) / PASR / 1-2 Day VolProf Low Volume area and 20 day rollin VolProf Low Volume area / Fib Retracement
1220-22 Daily S1 / 50 Day SMA / PASR
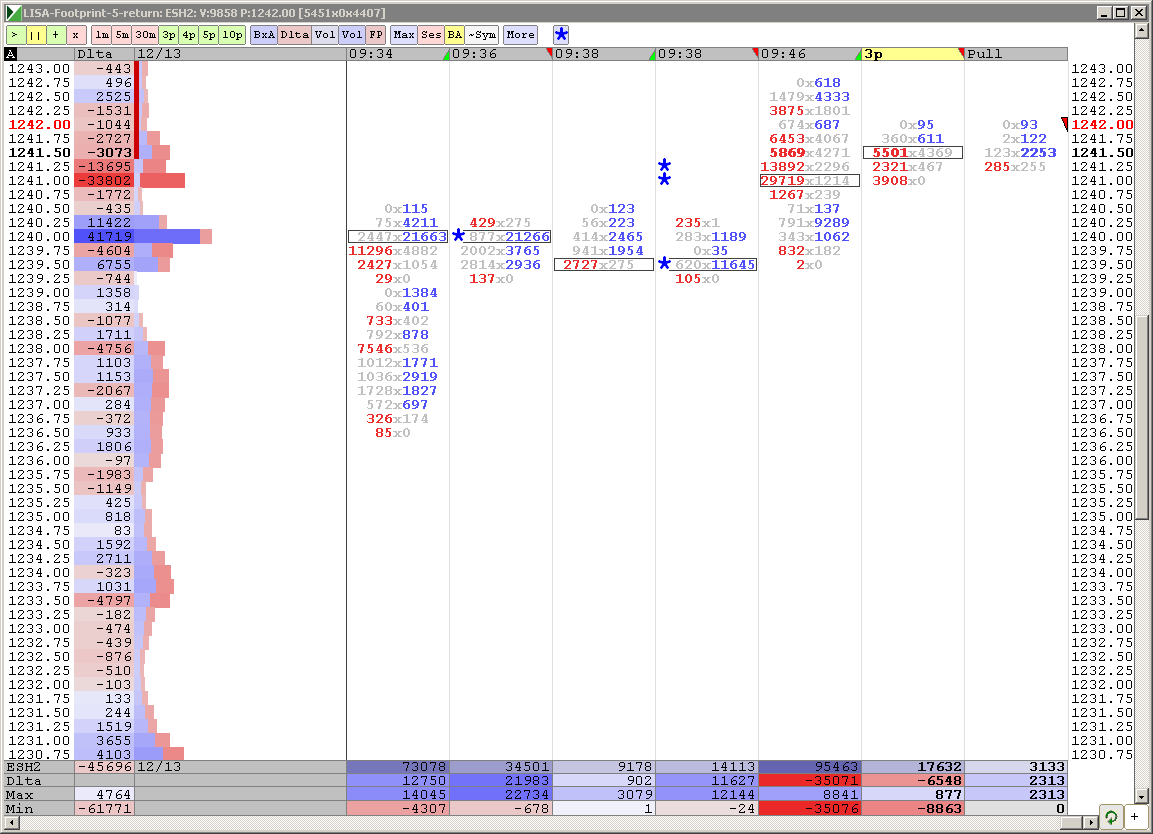
Thanks MM. The key low volume areas I am working from are:
1225 - 1226
1232- 1233
1235 - 1236
1241
1243.75 - 1245
Interesting how the market will trade to where the big volume is on the VERTICAL scale . Those numbers are:
1228.25
1240.50
1248.50
On the Ym the low volume areas are:
11905 - 11920
11977 - 11982
12021 - 12027
12068 - 12075
Hoping tomorrow leads to some better trading.Damn these ranges and key areas are fairly tight in some spots.
Just some commentary from experience fwiw. These "overlapping" WR Daily bars tend to retrace back and forth a lot. It's not a sure-thang (nothing is), but my read on the market is that there's another at least partial retrace of Monday's daily bar.
I'm looking at 1239-40 as a "magnet" ... which may take place overnight. Just my extra cent-and-a-half if price punches up and holds above the 1232-33 PASR line I had.
I'm looking at 1239-40 as a "magnet" ... which may take place overnight. Just my extra cent-and-a-half if price punches up and holds above the 1232-33 PASR line I had.
computer still mested up internet exsporer and tradestation not getting along
looking for 40.50 to be retested..so selling 41.75 !!
volume
Click image for original size

adding at 42.50 today...no footprints working!!
44.25 LV 12/09 market up oil up on Iran
Coming to yes's volume trough @ 1244.50
Click image for original size
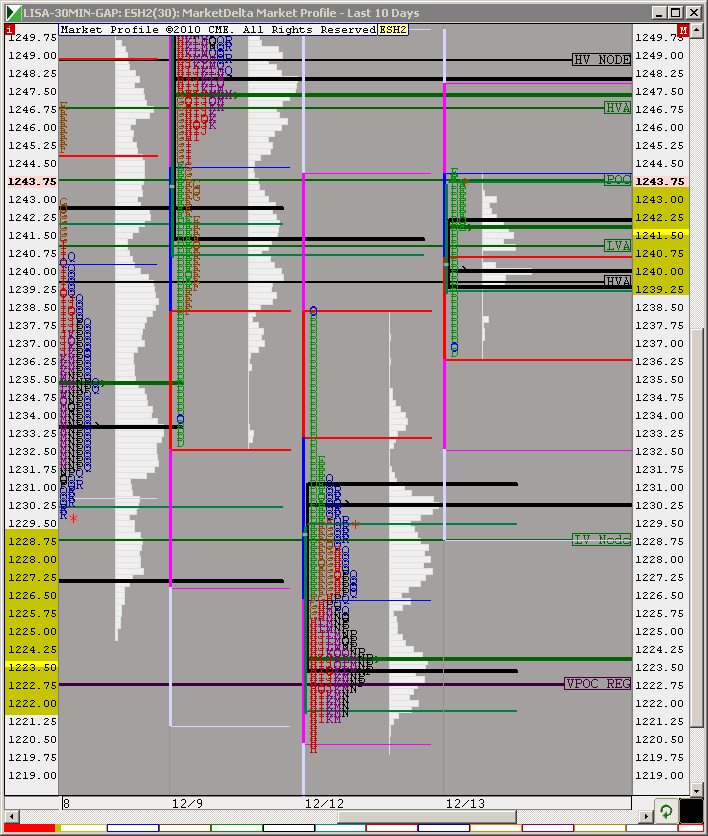
Gap is getting slowly filled...lookin at 1200 range....wednesday?
Emini Day Trading /
Daily Notes /
Forecast /
Economic Events /
Search /
Terms and Conditions /
Disclaimer /
Books /
Online Books /
Site Map /
Contact /
Privacy Policy /
Links /
About /
Day Trading Forum /
Investment Calculators /
Pivot Point Calculator /
Market Profile Generator /
Fibonacci Calculator /
Mailing List /
Advertise Here /
Articles /
Financial Terms /
Brokers /
Software /
Holidays /
Stock Split Calendar /
Mortgage Calculator /
Donate
Copyright © 2004-2023, MyPivots. All rights reserved.
Copyright © 2004-2023, MyPivots. All rights reserved.