ES Monday 1-9-12
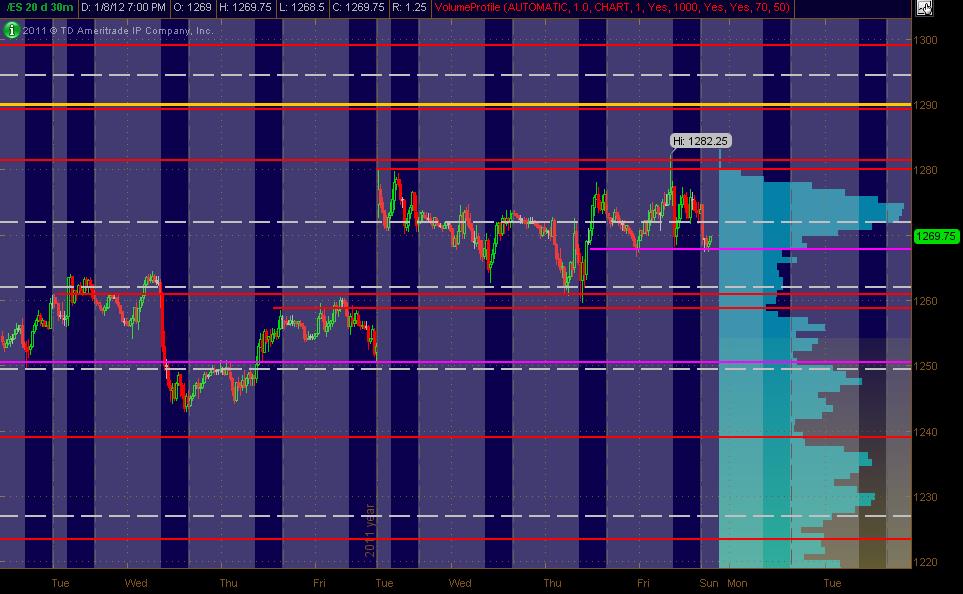
Here's what I've got for my ES MAP of PASR ZONES using a 30min chart of 20 days of data coming into Monday's trading. The Red lines are potential significant levels with Magenta lines as semi-significant. The White dashed lines are the Weekly Pivots. Have one Yellow line for a Fib cluster fwiw. The Light Blue Volume Profile of the past "rolling" 20 days is displayed on the right vertical axis. The Gray background shows non-RTH price activity. Hope, as always, that this is helpful to some as a "MAP."
Primary price levels/zones I'm looking at:
1289-90 PASR level / Daily R2 (RTH calcs and others) / Fib cluster
1280-82 PASR Zone / Daily R1
1274-75 Daily Mid Pvt (all trading hours) / VolProfile HVN on 20 day “rolling” and on 1 and 2 day as well
1259-61 PASR Zone
1250 Minor PASR / Wkly Pvt
Bruce posted a chart showing a well-shaped bell curve (MP I think) ... and looking at the daily ES chart shows the old fashioned "ascending triangle" (for now). The idea being that a strong push out of this area is likely (up or down), but based on the multi-frame chart patterns and price action ... for me, tends to favor a break to the upside within a day or few this week. Just my "read" for now.
Click image for original size
Primary price levels/zones I'm looking at:
1289-90 PASR level / Daily R2 (RTH calcs and others) / Fib cluster
1280-82 PASR Zone / Daily R1
1274-75 Daily Mid Pvt (all trading hours) / VolProfile HVN on 20 day “rolling” and on 1 and 2 day as well
1259-61 PASR Zone
1250 Minor PASR / Wkly Pvt
Bruce posted a chart showing a well-shaped bell curve (MP I think) ... and looking at the daily ES chart shows the old fashioned "ascending triangle" (for now). The idea being that a strong push out of this area is likely (up or down), but based on the multi-frame chart patterns and price action ... for me, tends to favor a break to the upside within a day or few this week. Just my "read" for now.
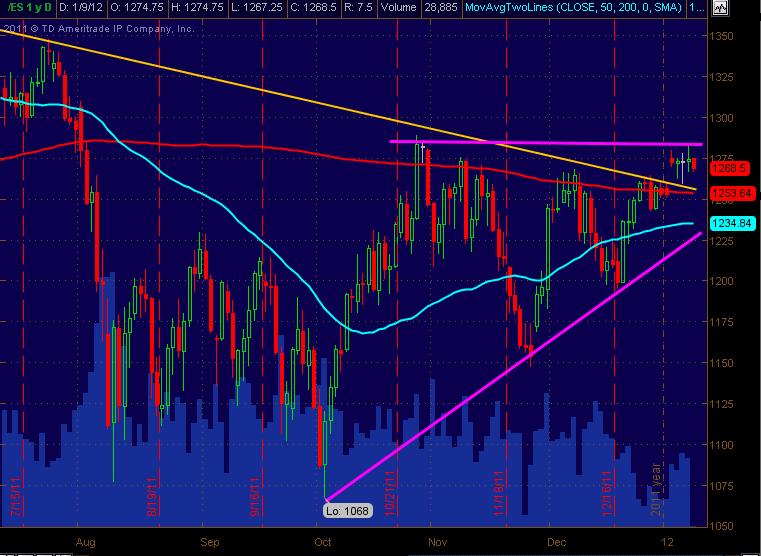
And the bigger picture with 50/200 SMAs along with Yellow trendline and Magenta "ascending triangle-ish thingy" on the Daily (all trading hours chart) with Volume in Cyan across the bottom of the chart.
Nothing exotic here ... just wanted to have the big-pic alongside the 30min chart with the listed levels. Most folks already have this chart as-is. Again, hope this helpful as an overall trading MAP!
Click image for original size
Nothing exotic here ... just wanted to have the big-pic alongside the 30min chart with the listed levels. Most folks already have this chart as-is. Again, hope this helpful as an overall trading MAP!
Thanks for posting. I still show a downward sloping tl on the hourly. price broke above it Friday but has slowly made it's way back towards it. Just another line. Will be watching this ascending triangle pretty heavily as it is so pronounced. I could see a lot of stops and limit buy/sell triggered to achieve the bigger move. Whichever direction that may end up.
74.50 is still the magnet and it will take volume to break it away from there. mean reversion trade until proven wrong.
69 - 70.50 is my first MINOR support zone for buys
63- 65.50 is my preferred buy zone as that will put us under the O/N low and into all the volume from 1-05
79 - 80 is first minor resistance but would prefer to sell against 82- 83
all the time keeping 74.50 in mind as an ultimate target. Lets see where the pitbull numbers fall today !
long hunt will begin near 71.50 as minus 4 starts there...
the mechanical pitbull traders would have bought the minus 2.5 number AFTER the minus 4 hit and exited at 74.50....
I prefer to look for changes in the footprint at the key areas as it gives a much better entry and target....
mean reversion at it's best today so far
I prefer to look for changes in the footprint at the key areas as it gives a much better entry and target....
mean reversion at it's best today so far
Originally posted by BruceM
the mechanical pitbull traders would have bought the minus 2.5 number AFTER the minus 4 hit and exited at 74.50....
Bruce, do you mean (-4) (-2.5) = (-6.5) from the "open" print?
no Lisa.....I posted the link for the pitbull thread the other day but let me know if you can't find it....
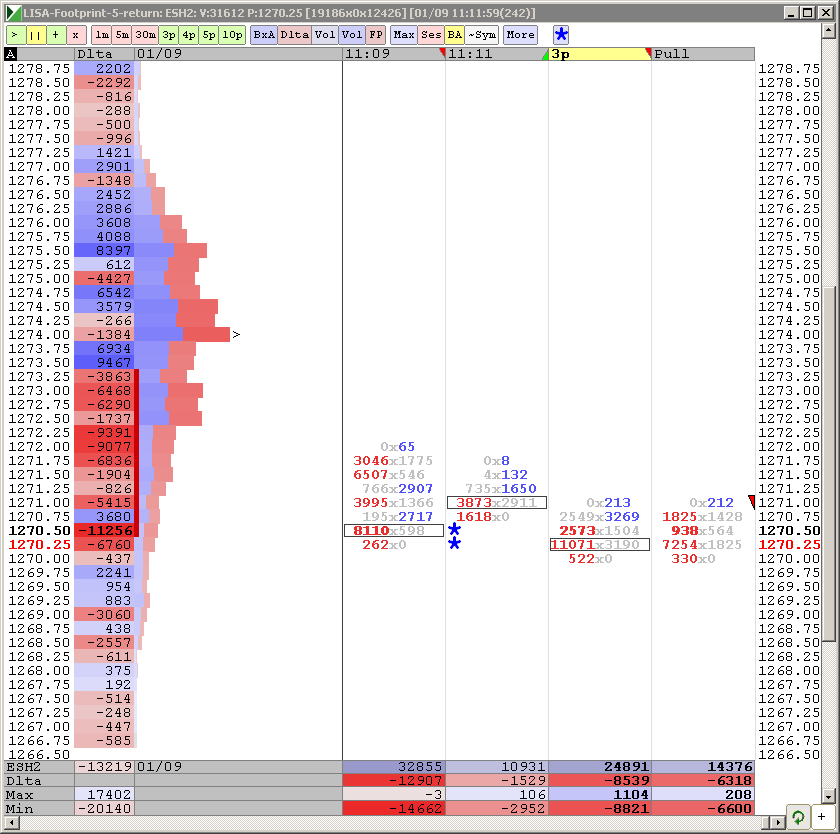
The pitbull numbers look like this for today:
Real time opening today is 1275.50...
the minus 2.5 is 73 ( 75.5 minus 2.5 points)
so we had the minus 4 at 71.50 ( 75.5 minus 4 points)
So when we hit the minus 4 number and stalled then the mechanical pitbul folks will buy the minus 2.5 number on the way back up.
I don't trade mechanical and find that just knowing where the pitbull numbers can be a tremendous help when looking at key flips in the footprint...
today for example my footprint flipped at 71.75....so that was my signal to get long at the market...especially with a pitbull number at 71.50
if we had dropped down to the minus 5.5 number (70 even) then I would have looked long agressively there...and close to the minus 4..
It only trades mechanical in the first 90 minutes...the numbers can be guidelines later on in the day too but not as effective...
We rarely just trend and keep going from the open print...so it tries to capitalize on the breakout traders covering failed trades and moving thge market back towards the open print
The 8 - 10 point numbers are good too...like friday...but the further we move from the open then the higher risk the trades are IMHO
small long at 70.75....keeping this small and tight
Sorry Bruce - I am in and out these days, may have missed some of your posts.
Volume
Volume
Click image for original size
all these long trades are higher risk because we consolidated in the first 90 minute and we know the market alternates between trend and consolidation...
this is also only a minor support zone....the pitbull "window" is also closed!!
this is also only a minor support zone....the pitbull "window" is also closed!!
Emini Day Trading /
Daily Notes /
Forecast /
Economic Events /
Search /
Terms and Conditions /
Disclaimer /
Books /
Online Books /
Site Map /
Contact /
Privacy Policy /
Links /
About /
Day Trading Forum /
Investment Calculators /
Pivot Point Calculator /
Market Profile Generator /
Fibonacci Calculator /
Mailing List /
Advertise Here /
Articles /
Financial Terms /
Brokers /
Software /
Holidays /
Stock Split Calendar /
Mortgage Calculator /
Donate
Copyright © 2004-2023, MyPivots. All rights reserved.
Copyright © 2004-2023, MyPivots. All rights reserved.