ES Thursday 19/Jan/2012
My apologies if I stepped on someone's thread starting turf....
Everyone's not only watching the ascending triangle, but the obvious tl's as well.
Can anyone provide MP notes on obvious stops above the tl on a breakout?

Everyone's not only watching the ascending triangle, but the obvious tl's as well.
Can anyone provide MP notes on obvious stops above the tl on a breakout?
looking 4 1307 retest off O/N failure..
Should have mentioned that this can be higher lows on an up move....see my next post
Originally posted by rburns
which higher highs Bruce?
In order to understand todays first pitbull trade failure you need to know the basic concept of the "segment count"...made popular by Joe Ross but my mentor altered it and used it on the 5 minute bars.
As it relates to the pitbull window my mentor usually didn't buy or sell after or on the 4th higher low or lower high on the 5 minute bars. This makes no excuse for the standard pitbull entries but it will help with filtering trades. Today the pitbull won on 2 out of three trades. Important to note that my mentor didnot use stops and often added into what looked like losing trades. So that first buy into the opening after we hit a minus 2.5 was not a loser to him.
To me that was a loser as it would be foolish to hold through a 4 point or more draw down just to catch 1.5 points of profit. He would not have taken that first trade because the market made 3 higher lows and broke that open print on the 4 th higher low. The segment count suckers people in after the 3rd bar completes and the 4th bar trades above it. YOU will see this happen all day and not just during the pitbull window . Whatch out after 3 in a row especially in the first 90 minutes
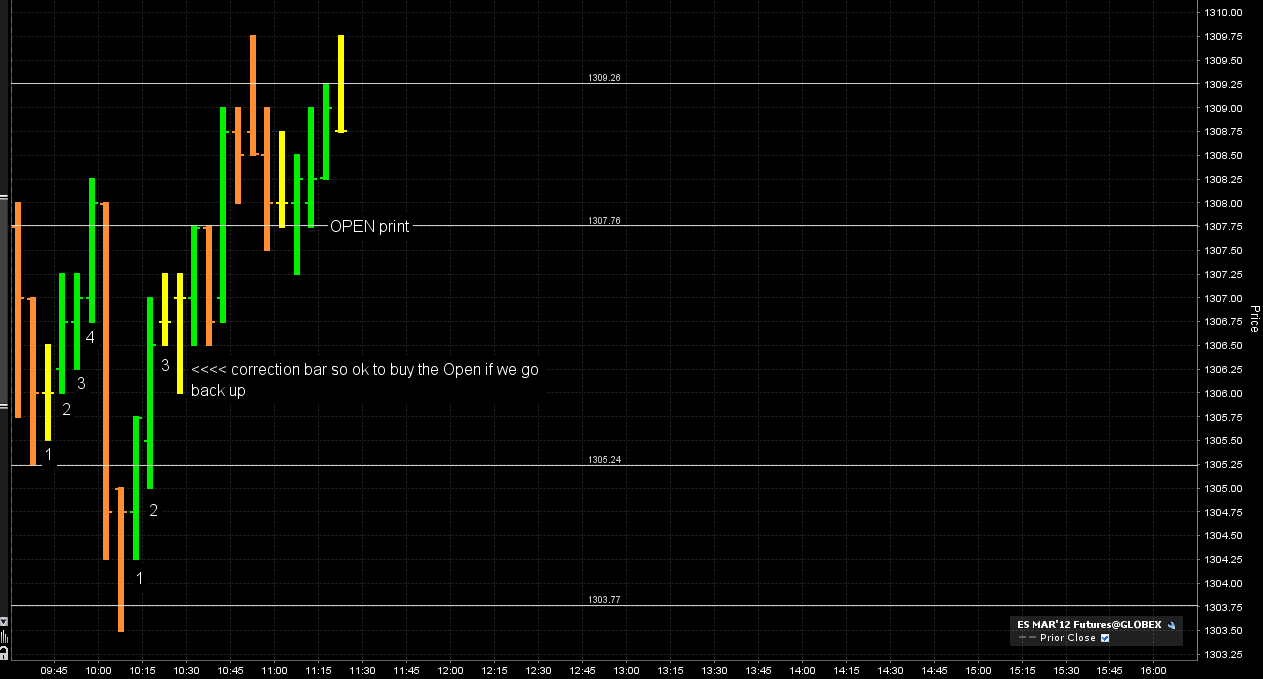
Here is my chart with the open print and the plus and minus 2.5 numbers snapped and the minus 4. Pitbull would be buying after the minus 4 at the minus 2.5 number...and then it would have bought on the second time back to the open print ( agressive trades in general) . The second time we had a nice correction bar after the third higher low so it made it safer to buy that open.
I'm not planning to keep posting on the pitbull but today we had a nuance that is worth mentioning....even if you took the first loser the pitbull still made good trades. Once we went 2.5 above and below the open then the pitbull window is closed. The other way the pitbull ends is if we get to 11 a.m.. So they closed the window just in time today.
my chart shows the two main segment counts mentioned. The first one has 4 higher lows...the second one has 3 higher lows and then we get the corrective bar. Ask questions if you have any...otherwise we shall put the pitbull back in his den and let him rest. I use the structure of the pitbull everyday but as I have mentioned I donot usually take the mechanical entries.
and watch for three higher highs or lower lows on the 5 minute in the first 90 minutes as a filter..repetition intentional.
As it relates to the pitbull window my mentor usually didn't buy or sell after or on the 4th higher low or lower high on the 5 minute bars. This makes no excuse for the standard pitbull entries but it will help with filtering trades. Today the pitbull won on 2 out of three trades. Important to note that my mentor didnot use stops and often added into what looked like losing trades. So that first buy into the opening after we hit a minus 2.5 was not a loser to him.
To me that was a loser as it would be foolish to hold through a 4 point or more draw down just to catch 1.5 points of profit. He would not have taken that first trade because the market made 3 higher lows and broke that open print on the 4 th higher low. The segment count suckers people in after the 3rd bar completes and the 4th bar trades above it. YOU will see this happen all day and not just during the pitbull window . Whatch out after 3 in a row especially in the first 90 minutes
Here is my chart with the open print and the plus and minus 2.5 numbers snapped and the minus 4. Pitbull would be buying after the minus 4 at the minus 2.5 number...and then it would have bought on the second time back to the open print ( agressive trades in general) . The second time we had a nice correction bar after the third higher low so it made it safer to buy that open.
I'm not planning to keep posting on the pitbull but today we had a nuance that is worth mentioning....even if you took the first loser the pitbull still made good trades. Once we went 2.5 above and below the open then the pitbull window is closed. The other way the pitbull ends is if we get to 11 a.m.. So they closed the window just in time today.
my chart shows the two main segment counts mentioned. The first one has 4 higher lows...the second one has 3 higher lows and then we get the corrective bar. Ask questions if you have any...otherwise we shall put the pitbull back in his den and let him rest. I use the structure of the pitbull everyday but as I have mentioned I donot usually take the mechanical entries.
and watch for three higher highs or lower lows on the 5 minute in the first 90 minutes as a filter..repetition intentional.
Click image for original size
I used the -4 pitbull in conjunction with yesterday's RTH for the trade of the day, so far.
Thanks Bruce!
Thanks Bruce!
this grind is a real torture
very cool mike...that's what forums and sharing ideas is all about...grab an idea and make it your own...well done mike...
that air pocket above that minus 4 was cool too...
that air pocket above that minus 4 was cool too...
Originally posted by Big Mike
I used the -4 pitbull in conjunction with yesterday's RTH for the trade of the day, so far.
Thanks Bruce!
thanks for taking the time Bruce to post your insight and help on the pitbull strategy. lots there to base a trading plan off of.
I don't think so as they will try to keep it away from the key rat at 1325...options expiration week and this is thursday...
we'll see...this is what makes a market..different opinions..thinking those trips at 1308 - 1309 need to be revisited again...ON high there too...
not even a plus 4 ...yikes...dulls ville!!
we'll see...this is what makes a market..different opinions..thinking those trips at 1308 - 1309 need to be revisited again...ON high there too...
not even a plus 4 ...yikes...dulls ville!!
this is great info bruce, thank you
Originally posted by BruceM
In order to understand todays first pitbull trade failure you need to know the basic concept of the "segment count"...made popular by Joe Ross but my mentor altered it and used it on the 5 minute bars.
As it relates to the pitbull window my mentor usually didn't buy or sell after or on the 4th higher low or lower high on the 5 minute bars. This makes no excuse for the standard pitbull entries but it will help with filtering trades. Today the pitbull won on 2 out of three trades. Important to note that my mentor didnot use stops and often added into what looked like losing trades. So that first buy into the opening after we hit a minus 2.5 was not a loser to him.
To me that was a loser as it would be foolish to hold through a 4 point or more draw down just to catch 1.5 points of profit. He would not have taken that first trade because the market made 3 higher lows and broke that open print on the 4 th higher low. The segment count suckers people in after the 3rd bar completes and the 4th bar trades above it. YOU will see this happen all day and not just during the pitbull window . Whatch out after 3 in a row especially in the first 90 minutes
Here is my chart with the open print and the plus and minus 2.5 numbers snapped and the minus 4. Pitbull would be buying after the minus 4 at the minus 2.5 number...and then it would have bought on the second time back to the open print ( agressive trades in general) . The second time we had a nice correction bar after the third higher low so it made it safer to buy that open.
I'm not planning to keep posting on the pitbull but today we had a nuance that is worth mentioning....even if you took the first loser the pitbull still made good trades. Once we went 2.5 above and below the open then the pitbull window is closed. The other way the pitbull ends is if we get to 11 a.m.. So they closed the window just in time today.
my chart shows the two main segment counts mentioned. The first one has 4 higher lows...the second one has 3 higher lows and then we get the corrective bar. Ask questions if you have any...otherwise we shall put the pitbull back in his den and let him rest. I use the structure of the pitbull everyday but as I have mentioned I donot usually take the mechanical entries.
and watch for three higher highs or lower lows on the 5 minute in the first 90 minutes as a filter..repetition intentional.
Click image for original size
correct..in a down trend you basically want to see a lower high or and equal high with a lower low...in and uptrend you want to see an higher low or a equal low with a higher high
you got it...we can also think of pure time...so they will push for 15- 20 minutes in one direction but then need to take a break....that break leads to reversals or just a pause before pushing further in the same direction...as usualy we can see what happens when the pushes end up at key areas...this shows the smart money is buying or selling ahead of a number and exiting when the number hits
you got it...we can also think of pure time...so they will push for 15- 20 minutes in one direction but then need to take a break....that break leads to reversals or just a pause before pushing further in the same direction...as usualy we can see what happens when the pushes end up at key areas...this shows the smart money is buying or selling ahead of a number and exiting when the number hits
Emini Day Trading /
Daily Notes /
Forecast /
Economic Events /
Search /
Terms and Conditions /
Disclaimer /
Books /
Online Books /
Site Map /
Contact /
Privacy Policy /
Links /
About /
Day Trading Forum /
Investment Calculators /
Pivot Point Calculator /
Market Profile Generator /
Fibonacci Calculator /
Mailing List /
Advertise Here /
Articles /
Financial Terms /
Brokers /
Software /
Holidays /
Stock Split Calendar /
Mortgage Calculator /
Donate
Copyright © 2004-2023, MyPivots. All rights reserved.
Copyright © 2004-2023, MyPivots. All rights reserved.