ES Thursday 1-26-12
Looking at 29 - 31 as a potential resitance zone as we approach the 9 a.m time frame...then I have the 21- 22 area as first real support ..below there is the 16 - 17.50..
biggest support zone will be the high and low volume combination down in the 1311 - 1313.50 area from yesterday
as usual we will see what the O/N ranges finalize at and where our pitbull numbers fall
biggest support zone will be the high and low volume combination down in the 1311 - 1313.50 area from yesterday
as usual we will see what the O/N ranges finalize at and where our pitbull numbers fall
a long ways to go yet but quite a lot of vol in middle of the range today, close below yest low would make a pretty ugly daily candle.... have to think all of the vol in 1308 area will provide supp though...
Lots of POC are congested between 7-12, 12 also has Highs for 19/20/24.. but the longs may not go far.. If we go under all of that volume under 7, that may be telling.. A possible long into the last 1/2hr/20min from 12ish might be worthwhile to maybe 16 tops..
gonna surprise me if it goes up from here...seems like too much in the way....a good time to kick back with Mr. Johnnie Walker and just watch !!
Y, prob a good idea on this one.. The HV can pull from lower as well and we're trending down below IB
that's all I wanted to see..that 10.75 weekly open...wasn't in it but it was cool to watch...hope all have a great evening;
thanks Bruce, u 2
fwiw... if this 9.25 holds... perfect test of the post FOMC pull back.... where triples were also sitting yest... I didn't get anything out of this,, just an observation.
Originally posted by BruceM
Paul...or anyone...go here...you can see charts and a cummulative volume profile...experiment and let me know if u need help with that site....but go to weekly chart and look at the swing high in the 1330 area..
http://www.cmegroup.com/trading/equity-index/us-index/e-mini-sandp500.html
Are you talking about these charts?
Click image for original size
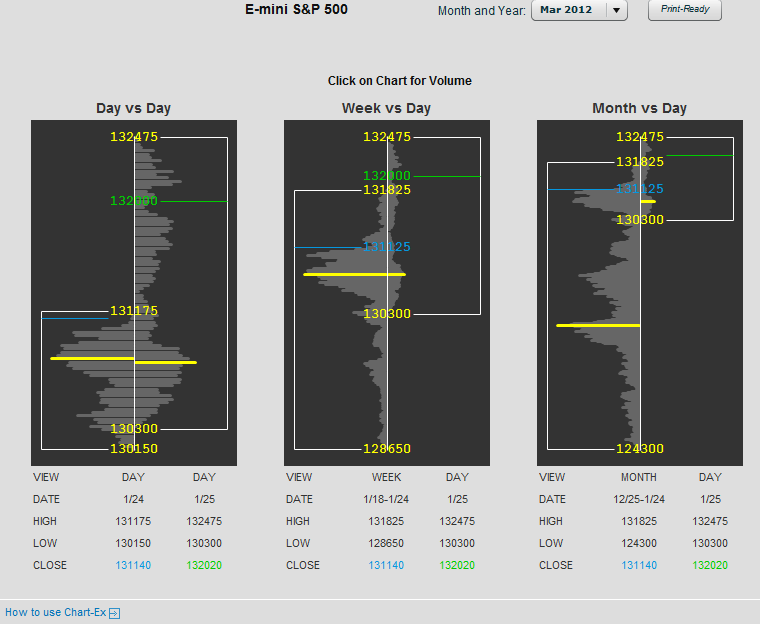
yes..that and just the plain old bar charts that you can get from the site...I don't use this site specifically but I will look at it to confirm my data when needed
Emini Day Trading /
Daily Notes /
Forecast /
Economic Events /
Search /
Terms and Conditions /
Disclaimer /
Books /
Online Books /
Site Map /
Contact /
Privacy Policy /
Links /
About /
Day Trading Forum /
Investment Calculators /
Pivot Point Calculator /
Market Profile Generator /
Fibonacci Calculator /
Mailing List /
Advertise Here /
Articles /
Financial Terms /
Brokers /
Software /
Holidays /
Stock Split Calendar /
Mortgage Calculator /
Donate
Copyright © 2004-2023, MyPivots. All rights reserved.
Copyright © 2004-2023, MyPivots. All rights reserved.