ES Thursday 1-26-12
Looking at 29 - 31 as a potential resitance zone as we approach the 9 a.m time frame...then I have the 21- 22 area as first real support ..below there is the 16 - 17.50..
biggest support zone will be the high and low volume combination down in the 1311 - 1313.50 area from yesterday
as usual we will see what the O/N ranges finalize at and where our pitbull numbers fall
biggest support zone will be the high and low volume combination down in the 1311 - 1313.50 area from yesterday
as usual we will see what the O/N ranges finalize at and where our pitbull numbers fall
volume update
Click image for original size

Paul...I run the weekly pivot points based on RTH only....this week had
1329, 1320 and 1303 that came into play.....
then I look at all session data...then the daily pivots...then old highs and lows and of course the volume profile work.
I usually put more effort into alternate forms of analysis when we are making new contract highs as I donot have great past reference points due to the spotty data......still on the cme website they show a weekly swing high up there too....
37 - 39 would also be important...
so basically new contract highs makes me work harder to find good numbers...then I look at the pitbull and recent ranges
Paul...or anyone...go here...you can see charts and a cummulative volume profile...experiment and let me know if u need help with that site....but go to weekly chart and look at the swing high in the 1330 area..
http://www.cmegroup.com/trading/equity-index/us-index/e-mini-sandp500.html
http://www.cmegroup.com/trading/equity-index/us-index/e-mini-sandp500.html
bear with me, Bruce. I'm an old man.
Thanks for the url, I didn't even know CME produced volume profile charts.
but when I went to the weekly price chart, the only 1330 area I could see took place ALLLLLL the way back in late July.
Is that weekly swing failure what you are referring to?
Thanks for the url, I didn't even know CME produced volume profile charts.
but when I went to the weekly price chart, the only 1330 area I could see took place ALLLLLL the way back in late July.
Is that weekly swing failure what you are referring to?
Paul,
You can see it on the daily chart as well.. July21/22
You can see it on the daily chart as well.. July21/22
Yes paul...these are long term reference points......Jdedi is correct ...we can treat any weekly high or low as critcial..same with monthly...too ofetn we assume that most use dailies but there are those out there who think that dailies are way too small......
two sets of single prints on the charts just in case anyone finds a good long signal down here
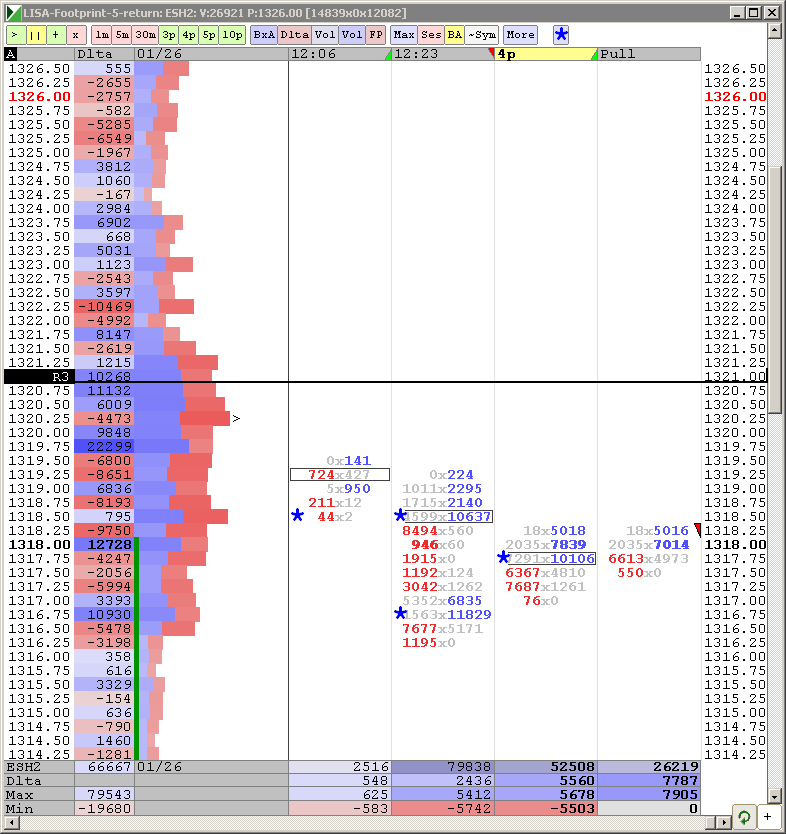
Not sure what this volume shows, perhaps quiet buying. Previous high volume (blue) was at 1321 and did not result in upward move. For WTW, here is my chart.
Click image for original size
Bruce . I’m not sure if I completely understand the “AIR” trade. is there an air between 1325.25 and 1323.25 today between 10:20 AM and 10:30 AM?
I greatly appreciate your answer
I greatly appreciate your answer
yes..that and just the plain old bar charts that you can get from the site...I don't use this site specifically but I will look at it to confirm my data when needed
Emini Day Trading /
Daily Notes /
Forecast /
Economic Events /
Search /
Terms and Conditions /
Disclaimer /
Books /
Online Books /
Site Map /
Contact /
Privacy Policy /
Links /
About /
Day Trading Forum /
Investment Calculators /
Pivot Point Calculator /
Market Profile Generator /
Fibonacci Calculator /
Mailing List /
Advertise Here /
Articles /
Financial Terms /
Brokers /
Software /
Holidays /
Stock Split Calendar /
Mortgage Calculator /
Donate
Copyright © 2004-2023, MyPivots. All rights reserved.
Copyright © 2004-2023, MyPivots. All rights reserved.