JI
jimkane
Rep: 3,058
Posts: 33,089
I sure wish someone else would step up and start these weekly topics...
JI
jimkane
Rep: 3,058
Posts: 33,089
1.75 points is quite a big checkback for this. It can't even seem to complete a low tick chart ABCD... Wow, the machines are relentless.
JI
jimkane
Rep: 3,058
Posts: 33,089
C'mon, bring it in. While I'm in Fantasyland I might as well say 'reverse it'.
JI
jimkane
Rep: 3,058
Posts: 33,089
Looks like that little ABCD will be it. Couldn't even get back to trend. A slightly bigger ABCD here would be cool, but I think it's a grind until close, right to the area I mentioned. Let's see.
JI
jimkane
Rep: 3,058
Posts: 33,089
Now, let's look at a totally hypothetical situation. Is it possible that I could be in a situation where I was long and riding a position, and 'rooting' for the market to dump? Yes, that is possible. Why? That seems to make no sense. Wouldn't one always 'root' for the maximum possible gain on that trade?
Not necessarily. Perhaps it is worth making less on one lone trade and having the market do something technical that may create more, and better, opportunities later on. Plus, maybe it's worth it to pay some money (via 'lost profits') just to see the bulls squirm, even if just for a second...
Not necessarily. Perhaps it is worth making less on one lone trade and having the market do something technical that may create more, and better, opportunities later on. Plus, maybe it's worth it to pay some money (via 'lost profits') just to see the bulls squirm, even if just for a second...
JI
jimkane
Rep: 3,058
Posts: 33,089
Anyone notice the rate of acceleration in AAPL, on say a daily chart? It is smokin'.
JI
jimkane
Rep: 3,058
Posts: 33,089
Okay, bigger ABCD, back to trend. This will tell the tale. Are they going to dump it? We'll know soon. Oh, please... Please, please, please.
JI
jimkane
Rep: 3,058
Posts: 33,089
It just doesn't seem coincidental how this area stopped it dead, and has held it back all this time. It even looks ready to sell in here. Now, I expect that may trigger the manipulators to come in hard for it here, as there is nothing but air below this point, but regardless, look how this stopped the movement up. I wonder why? The tools, in my opinion.
Originally posted by jimkane
47.25 stops it dead. Now we see. Amazing it 'saw' it at all. This is it, folks, do or die, now we really see about this recent high.
Originally posted by jimkane
So, forget the sellers for now. I'm watching 47.00-48.25 as a really tough area. But, when they want new highs, the things that make an area like this are usually totally ignored. So, once they bust over this spot in here (any second now...) I don't think it will encounter much resistance until the new highs.
JI
jimkane
Rep: 3,058
Posts: 33,089
It would be amazing if they close cash right at this key level, but I think they will try to take it out in the last few minutes, or in the after-cash. If not, then after all the monster blowout earnings that will be announced after the close. One way or another, another new high for the move should be upon us soon, I suspect.
JI
jimkane
Rep: 3,058
Posts: 33,089
And if the earnings miss expectations, like DIS, we know that will lead to a higher price in most cases, right? Hence, up for the ES.
JI
jimkane
Rep: 3,058
Posts: 33,089
Okay, they cash closed it right at the area. Now they explode it up? On CSCO blowout earnings?
SI
sirios
Rep: 0
Posts: 157
Post like this has incredible value for my learning process. Thank you Jim.
I've got many questions how to act in few areas which are shown on the chart and I found are critical in early stage of trade, but I know you can't answer it on the forum. I have ideas and experiment with it and I'm very interested in opinion about it.
I've got many questions how to act in few areas which are shown on the chart and I found are critical in early stage of trade, but I know you can't answer it on the forum. I have ideas and experiment with it and I'm very interested in opinion about it.
Originally posted by jimkane
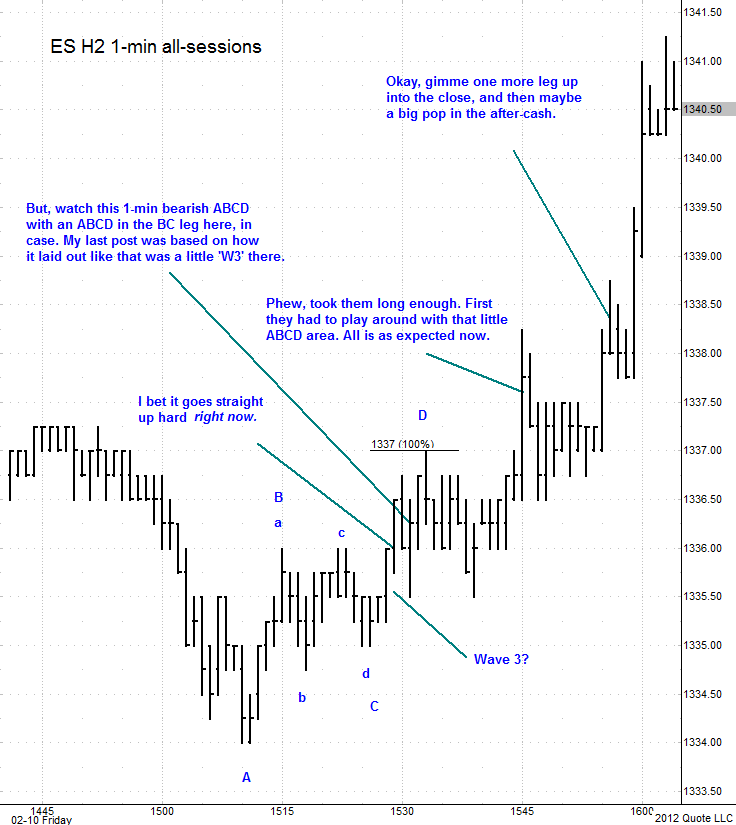
Okay, here's a chart showing some of my posts, marked at the times, as best as I could do it, when I posted them. Also check out the post I made at 15:53:40. I couldn't find the room to squeeze that one on the chart. Everything I mentioned was based on the methodology. Look at some of the other posts, like the one about the lines coming in. Look at that EXP ABCD. Study the higher timeframes and see why I thought this may go up (other than it was Friday close and time to prep for Sunday night GLOBEX/Monday).
No matter how many cool areas lie below, or how much I want this to sell, 'they' want it up, and the defense of the GZ was a clear signal. Note my post before I started this sequence, about rigorously defending the LOD via the GZ. It wasn't my first mention of that. Clues. Technical factors. The methodology. What roofer likes to call 'the tools'. Now, do some work. Study what led up to what I have shown here.
Click image for original size
Chart created on QCharts, courtesy eSignal.