JI
jimkane
Rep: 3,058
Posts: 33,089
I sure wish someone else would step up and start these weekly topics...
MA
MarcinO
Rep: 67
Posts: 5,506
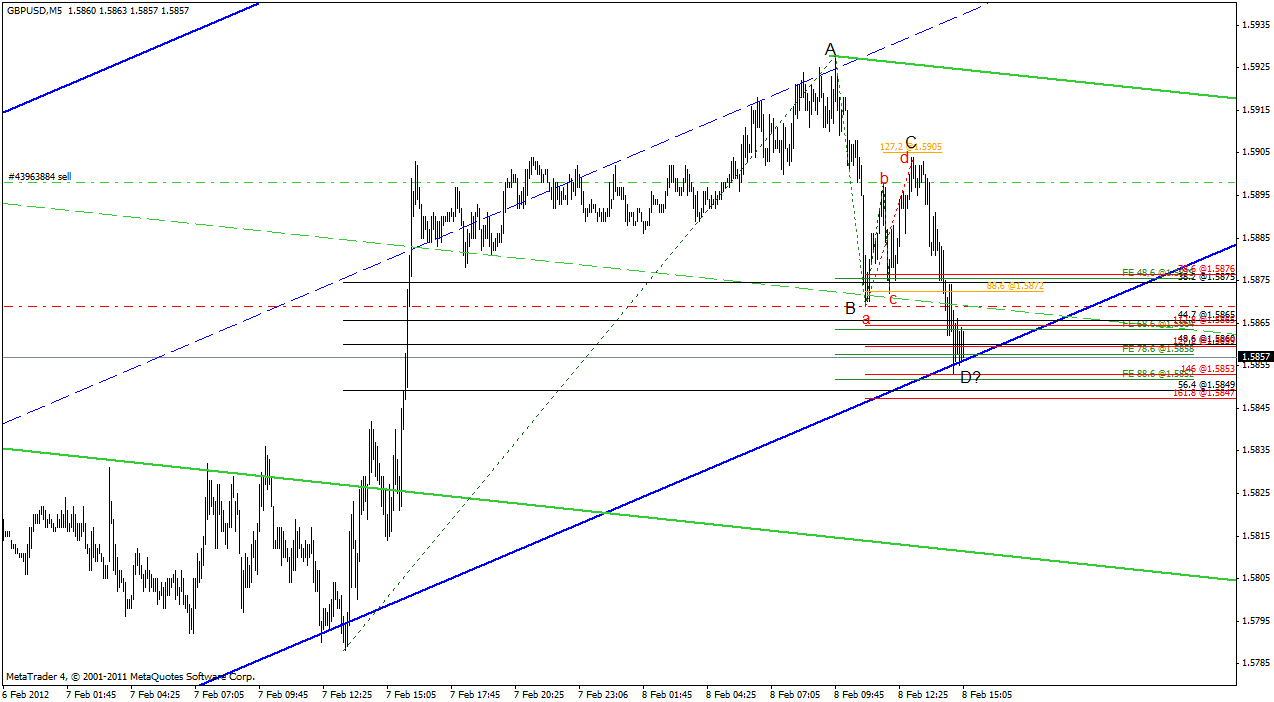
GBPUSD 30min ABCD set-up is in line with longer term 4H trend.
Would you guys consider trading red abcd opposite to this direction or skip it?
d point was over retracements grouping.
I still think about the latest context discussion...
Would you guys consider trading red abcd opposite to this direction or skip it?
d point was over retracements grouping.
I still think about the latest context discussion...
Click image for original size
SI
sirios
Rep: 0
Posts: 157
Context is first, so now, I do not consider this bearish ABCD. But this bullish ABCD looks very nice.
Originally posted by MarcinO
GBPUSD 30min ABCD set-up is in line with longer term 4H trend.
Would you guys consider trading red abcd opposite to this direction or skip it?
d point was over retracements grouping.
I still think about the latest context discussion...
MA
MarcinO
Rep: 67
Posts: 5,506
Thank you for reply Sirios
The bullish one didn't give an entry trigger, luckilly.
The bullish one didn't give an entry trigger, luckilly.
Originally posted by sirios
Context is first, so now, I do not consider this bearish ABCD. But this bullish ABCD looks very nice.
Originally posted by MarcinO
GBPUSD 30min ABCD set-up is in line with longer term 4H trend.
Would you guys consider trading red abcd opposite to this direction or skip it?
d point was over retracements grouping.
I still think about the latest context discussion...
SI
sirios
Rep: 0
Posts: 157
Not at all.
Yes, they started some selling stocks, EUR and GBP.
Yes, they started some selling stocks, EUR and GBP.
Originally posted by MarcinO
Thank you for reply Sirios
The bullish one didn't give an entry trigger, luckilly.
AL
albert
Rep: 99
Posts: 3,094
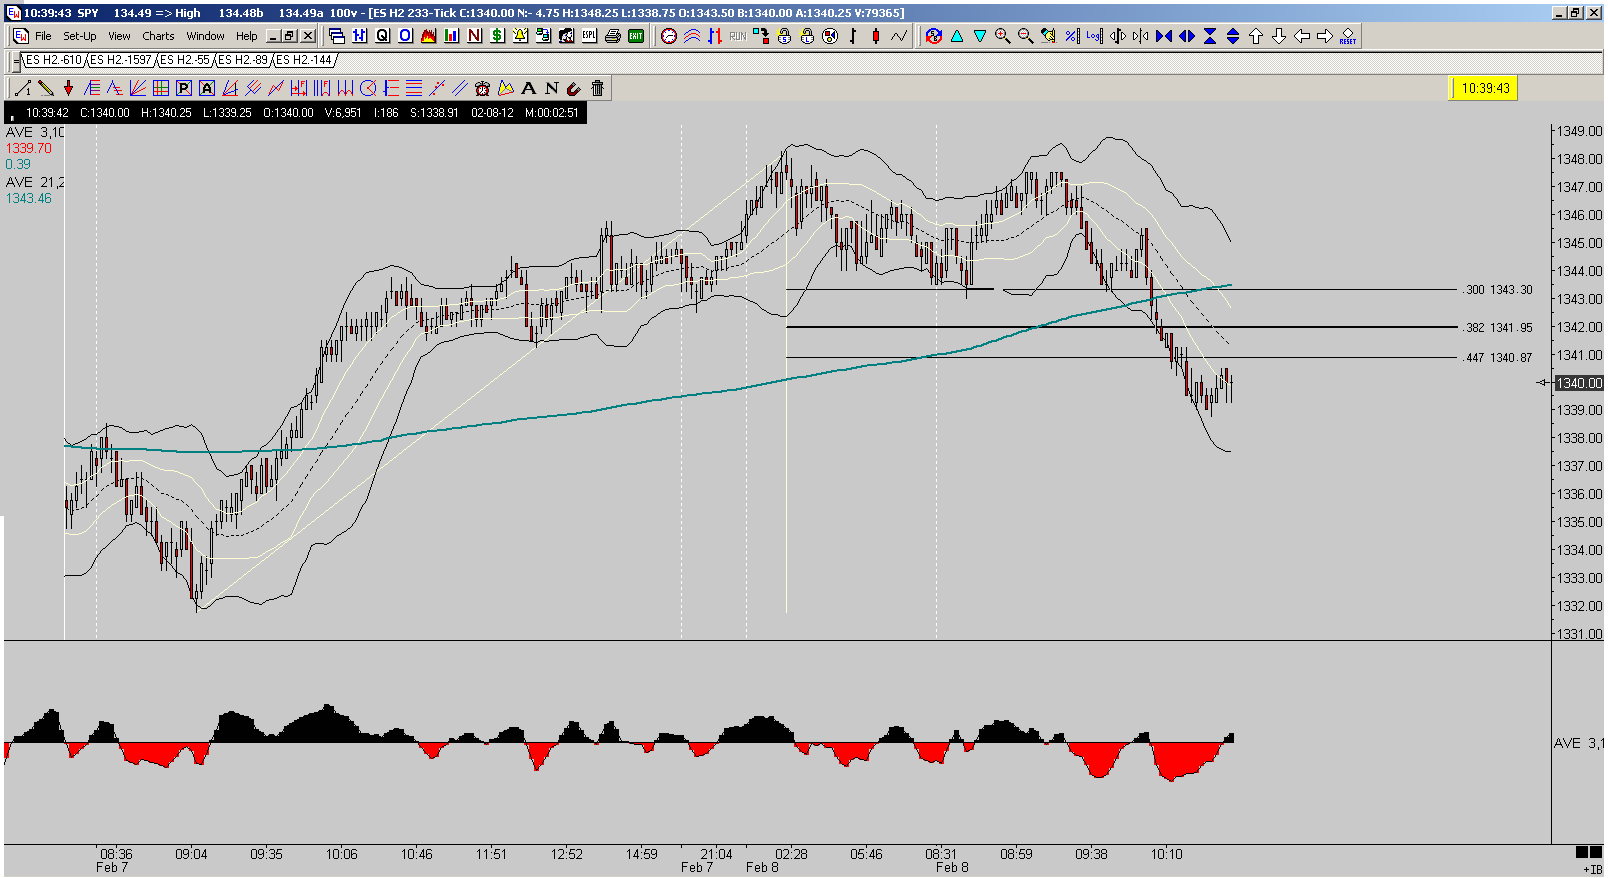
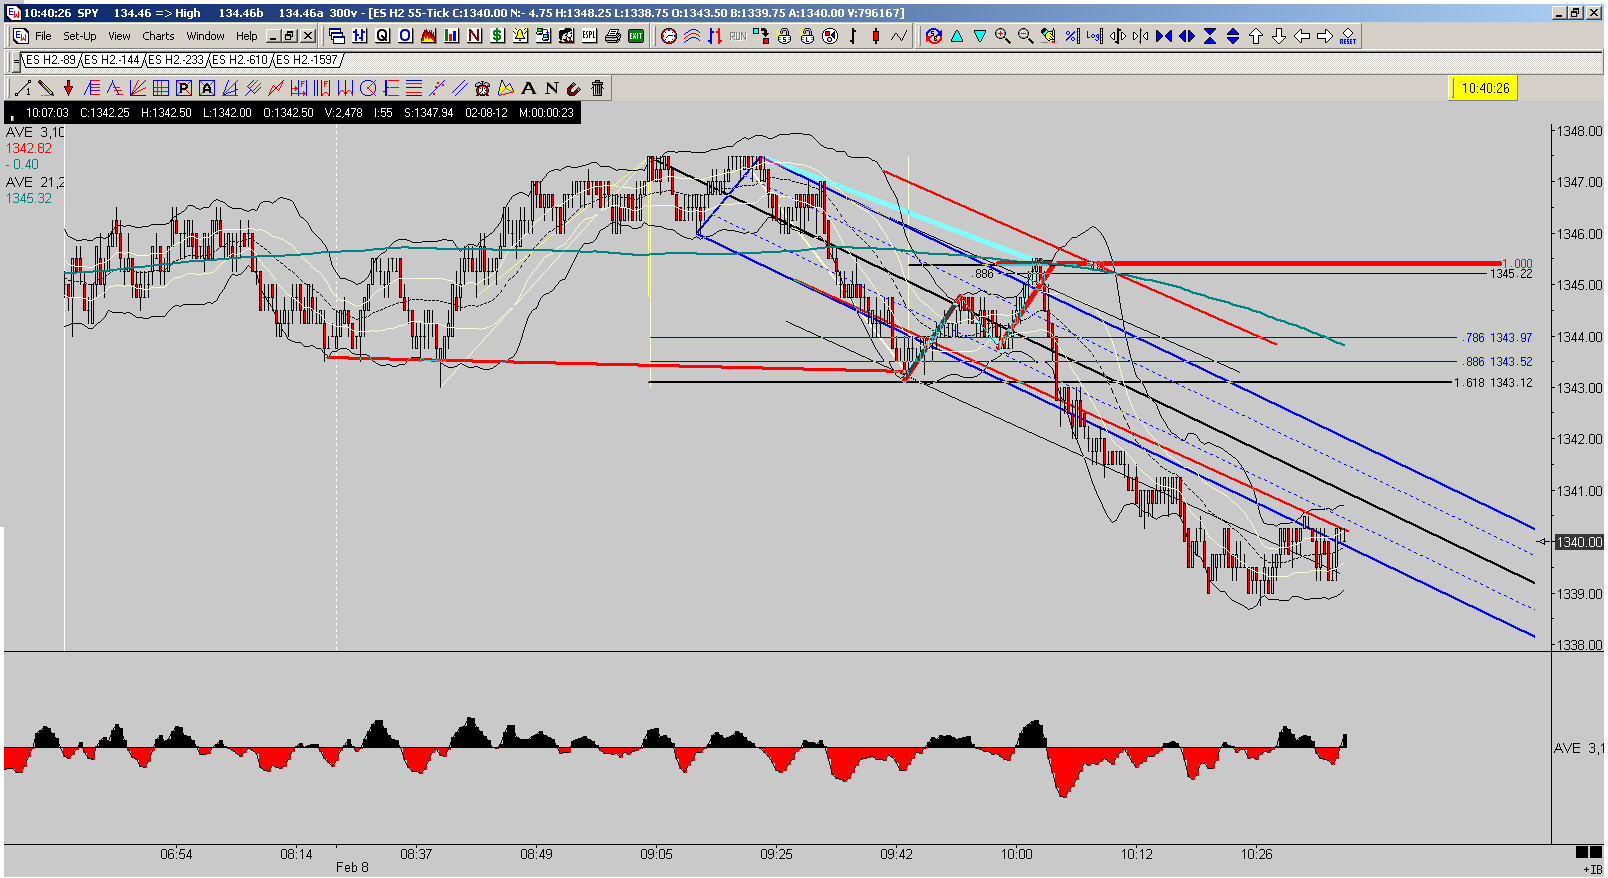
OK. I am still paper trading. I need to train my brain. Why can't I think in more than one timeframe? DOH! Potential Kane 4PCP completing at 0.300 fibo. Price formed a Tweezer Tops at 21 SMA and reversed direction. I did not realize, until it was way too late (and I got distracted), that another of those DT setups where the price retests MAs and then forms a Kane PLF at SL/200 SMA/ Warning Line confluence was forming on a lower TF.
Al Kamego
Al Kamego
Click image for original size
Click image for original size
JI
jimkane
Rep: 3,058
Posts: 33,089
DIS up well over 2% at today's high. Like that was hard to see coming...
Originally posted by jimkane
Wait, DIS is down in the after-market? That's a complete impossibility. They must be setting it up to get better prices from the suckers, and then it will rocket straight up...
JI
jimkane
Rep: 3,058
Posts: 33,089
Yes, very much so, but it's a critical area to watch for clues, management on an existing long, and even a possible shorting spot if there is more of a top in there.
JI
jimkane
Rep: 3,058
Posts: 33,089
Well, they made quite a statement there, now, didn't they? There is a reason why I am watching the high there at 45.50, in case this was a stop run and then done... Otherwise, I just see this as a 'ride until close'.
SI
sirios
Rep: 0
Posts: 157
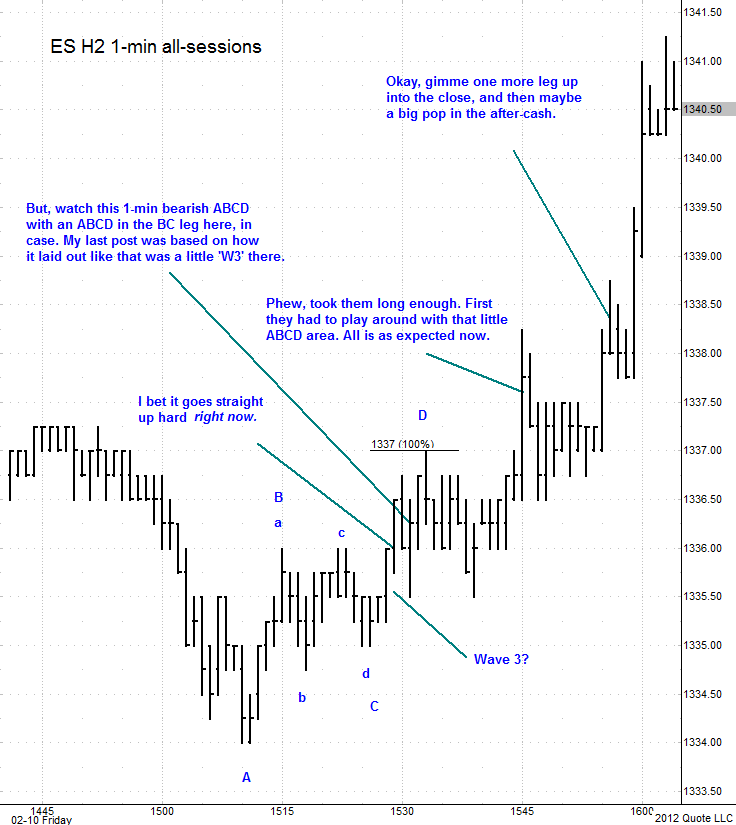
Post like this has incredible value for my learning process. Thank you Jim.
I've got many questions how to act in few areas which are shown on the chart and I found are critical in early stage of trade, but I know you can't answer it on the forum. I have ideas and experiment with it and I'm very interested in opinion about it.
I've got many questions how to act in few areas which are shown on the chart and I found are critical in early stage of trade, but I know you can't answer it on the forum. I have ideas and experiment with it and I'm very interested in opinion about it.
Originally posted by jimkane
Okay, here's a chart showing some of my posts, marked at the times, as best as I could do it, when I posted them. Also check out the post I made at 15:53:40. I couldn't find the room to squeeze that one on the chart. Everything I mentioned was based on the methodology. Look at some of the other posts, like the one about the lines coming in. Look at that EXP ABCD. Study the higher timeframes and see why I thought this may go up (other than it was Friday close and time to prep for Sunday night GLOBEX/Monday).
No matter how many cool areas lie below, or how much I want this to sell, 'they' want it up, and the defense of the GZ was a clear signal. Note my post before I started this sequence, about rigorously defending the LOD via the GZ. It wasn't my first mention of that. Clues. Technical factors. The methodology. What roofer likes to call 'the tools'. Now, do some work. Study what led up to what I have shown here.
Click image for original size
Chart created on QCharts, courtesy eSignal.