JI
jimkane
Rep: 3,058
Posts: 33,089
I sure wish someone else would step up and start these weekly topics...
JI
jimkane
Rep: 3,058
Posts: 33,089
ES has an ABCD here. Let's see if that gets them going on the upside again in their pathetic grind.
JI
jimkane
Rep: 3,058
Posts: 33,089
Now, here's something we do know. It wants 55-56 real, real bad. Like a spoiled brat wants cookies and candy right before dinner. So, what will it do here now that it 'failed' at 51? Lay down?
JI
jimkane
Rep: 3,058
Posts: 33,089
Too bad there isn't anyone to collect that gazillion from...
Originally posted by jimkane
Okay, I bet a gazillion dollars it can't get above 51 here
JI
jimkane
Rep: 3,058
Posts: 33,089
48.00-.50 is a key spot for them to play their spoiled brat game from, or maybe 47.25-.50, so let's watch that for clues.
JI
jimkane
Rep: 3,058
Posts: 33,089
Jumps off 48.25 like it had a rocket up its backside. But, right to the spot it would fade if this is still just 'chop' and they have no gas left in the tank for that shot at 55-56. So, now we see.
FI
fib21
Rep: 0
Posts: 40
Besides the fact that there were some key TL's right in here the reason it rejected 51 was that it needed a larger pullback. That's what I came up with.
JI
jimkane
Rep: 3,058
Posts: 33,089
50 here is a real line in the sand between chop and a real assault at 55-56, or at least the highs.
SI
sirios
Rep: 0
Posts: 157
Post like this has incredible value for my learning process. Thank you Jim.
I've got many questions how to act in few areas which are shown on the chart and I found are critical in early stage of trade, but I know you can't answer it on the forum. I have ideas and experiment with it and I'm very interested in opinion about it.
I've got many questions how to act in few areas which are shown on the chart and I found are critical in early stage of trade, but I know you can't answer it on the forum. I have ideas and experiment with it and I'm very interested in opinion about it.
Originally posted by jimkane
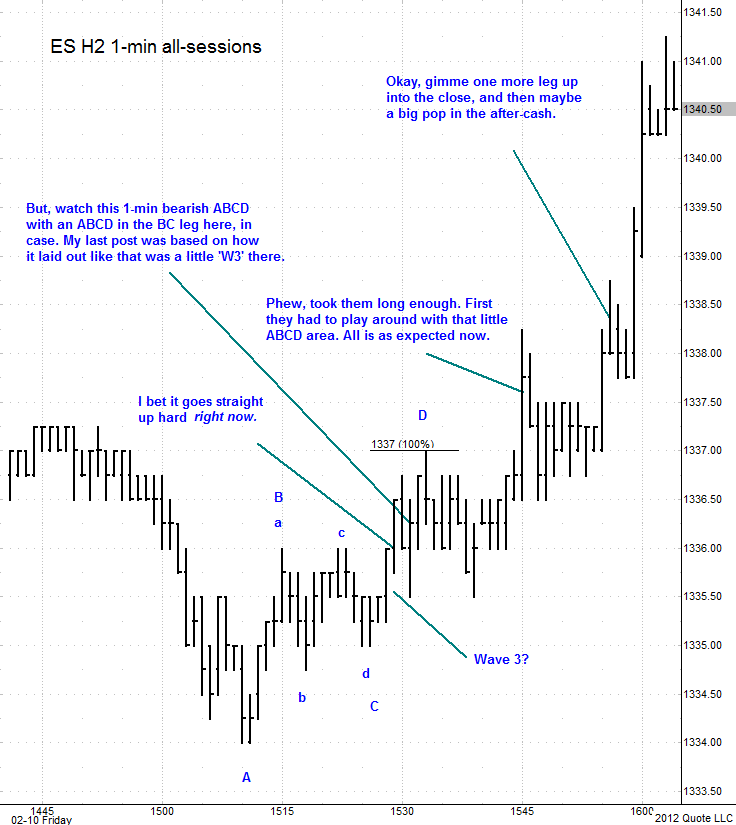
Okay, here's a chart showing some of my posts, marked at the times, as best as I could do it, when I posted them. Also check out the post I made at 15:53:40. I couldn't find the room to squeeze that one on the chart. Everything I mentioned was based on the methodology. Look at some of the other posts, like the one about the lines coming in. Look at that EXP ABCD. Study the higher timeframes and see why I thought this may go up (other than it was Friday close and time to prep for Sunday night GLOBEX/Monday).
No matter how many cool areas lie below, or how much I want this to sell, 'they' want it up, and the defense of the GZ was a clear signal. Note my post before I started this sequence, about rigorously defending the LOD via the GZ. It wasn't my first mention of that. Clues. Technical factors. The methodology. What roofer likes to call 'the tools'. Now, do some work. Study what led up to what I have shown here.
Click image for original size
Chart created on QCharts, courtesy eSignal.