I'll start it off again this week, early. I'm going to make a few posts regarding sentiment and other such things as I feel we are getting close. It's either already done, or it has to have that final, insane, suck every last one in blow off move. I'd hate to think that move carries all the way to 2000, but it may.
Many are watching the 1750-75 area and areas near that, so I think the odds of that being it are very slim (you never know, though, especially if they say that area will only check it back a little, or not at all, and then they post higher levels, which is what I suspect they will do...).
I wish it could be here, but I just don't see it. Also keep in kind, the debt ceiling is coming up again this fall, so maybe that's the phony catalyst. I just don't know. Anyway, some sentiment to ponder coming up.
http://slopeofhope.com/2013/07/runaway-russell-epiphany.html
JI
jimkane
Rep: 3,058
Posts: 33,089
So, the ES gets the contract high today, as expected... Will anything ever stop this juggernaut of a market?
MA
MarcinO
Rep: 67
Posts: 5,506
Yes. It went over 12 points up after hitting the first area.
Originally posted by jimkane
Anyone see TSLA today? It's not like I didn't post it...
RA
rat89
Rep: 0
Posts: 7,015
I'm very tough on myself....i think i still have a ways to go...
Originally posted by roofer
i think rat pretty much has down pat what i showed him....
JI
jimkane
Rep: 3,058
Posts: 33,089
Here's the TSLA chart updated. Note that this is just a framework. Look how it went right to both the intersection/overlap areas of the two sets. Very cool.
Chart created on QCharts, courtesy eSignal
Click image for original size
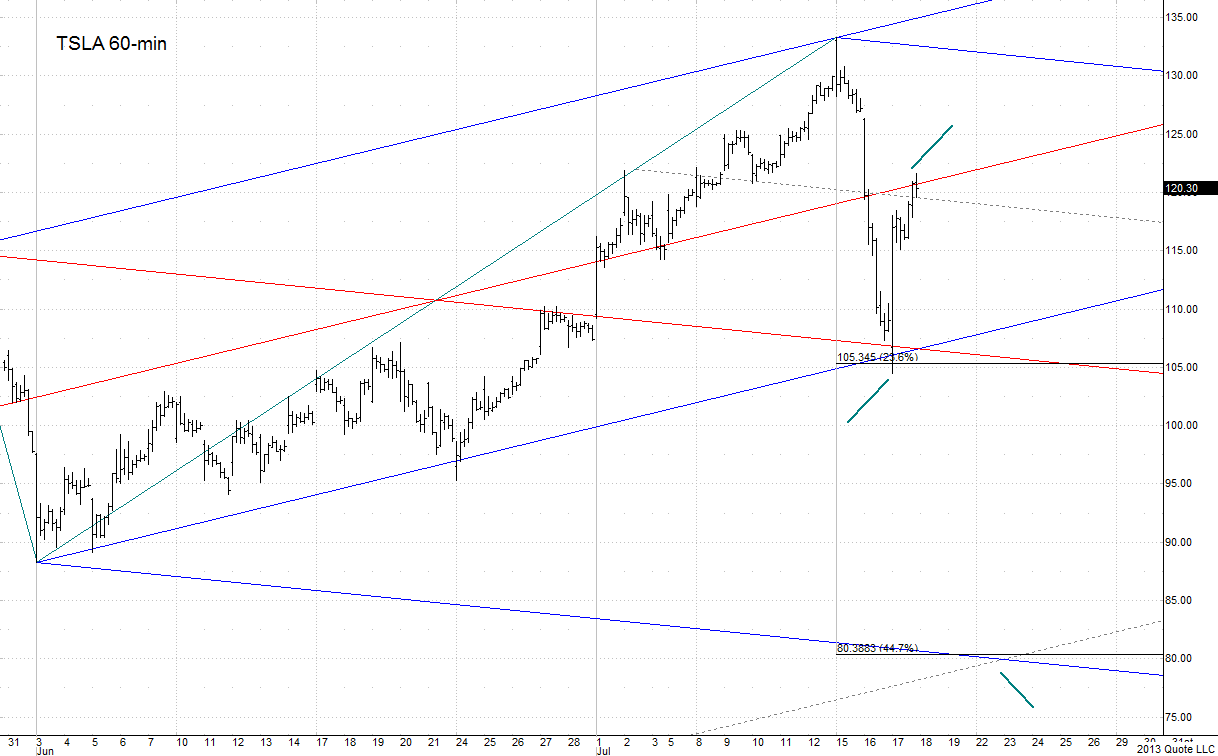
Chart created on QCharts, courtesy eSignal
JI
jimkane
Rep: 3,058
Posts: 33,089
It's a little dry and mathematical, but just wait for that $10.8 trillion punchline, and you'll see the point. Biggest wealth transfer (all of what's been going on) in human history.
P.S. By 'wealth transfer' I mean 'outright theft'.
http://www.zerohedge.com/news/2013-07-17/savers-and-real-108-trillion-cost-zirp
P.S. By 'wealth transfer' I mean 'outright theft'.
http://www.zerohedge.com/news/2013-07-17/savers-and-real-108-trillion-cost-zirp
AL
albert
Rep: 99
Posts: 3,094
Originally posted by jimkane
Here's the TSLA chart updated. Note that this is just a framework. Look how it went right to both the intersection/overlap areas of the two sets. Very cool.
Click image for original size
Chart created on QCharts, courtesy eSignal
Simply amazing!
Al Kamego
JI
jimkane
Rep: 3,058
Posts: 33,089
Let me just do a brief summary. The ES got all the previous intraday highs, including the June contract high (as shown in the #F contract). The S&P index hit all-time new highs, as did the Dow, the transports, the MidCaps, and the Russell. The NASDAQ composite and 100 hit new 'bulls#%&' market highs, as did the banking index. There are many others, but why list them. And crude took out 108. Wasn't I saying something about it must hit 110, and then we see if it is going to take out that 148 area all-time high? So, in answer to my question below, no, I see nothing that can stop this thing. That being said, they may allow it to come in now that basically all highs of every kind have been vanquished (but it would really surprise me...).
Originally posted by jimkane
So, the ES gets the contract high today, as expected... Will anything ever stop this juggernaut of a market?
JI
jimkane
Rep: 3,058
Posts: 33,089
This should get the weekend started off on a good note...
http://www.zerohedge.com/news/2013-07-19/friday-fiction-or-fact-funny-drunk-ben-bernanke-speaks
http://www.zerohedge.com/news/2013-07-19/friday-fiction-or-fact-funny-drunk-ben-bernanke-speaks