ES Friday 10-25-13
Two videos today...one showing the Automatic Line Generator Method...or affectionately know as the A.L.G.M.... Ha ! .second video covers the profile to just confirm the areas and the daily bar
.this is just gambling in front of a report ..so keep it small is my advice if u play..went flat at 49 print just too close ..so taking small pieces and will wait untill 10 a.m now
I'd like to see a push under 46.50 to look for a long or a push above the 51.75 for sells...Ideally near the 53.50...I'm not using the 48 - 49 to initiate from post report
so cool how the selling tail from yesterday is trying to be support....is it any wonder where overnight vpoc is ?? they can't even get a gap fill yet
agree, 45.5 would be perfect imo for a long try back to 48.5-49
on the 53.25...and light...trying for 51.50 ...in front of our 51.25 line
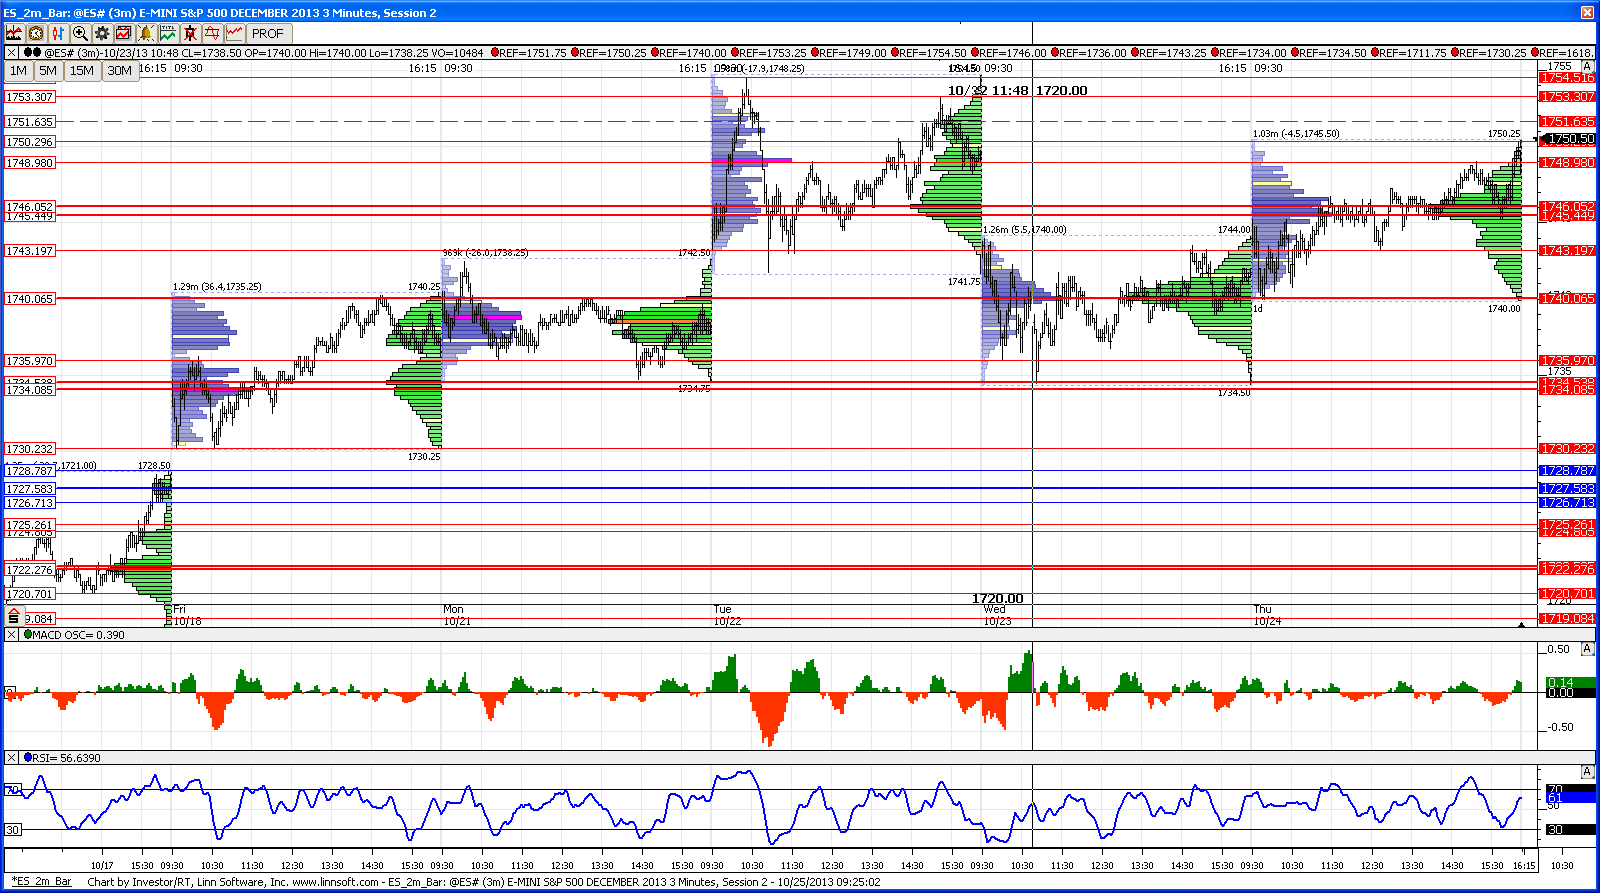
gap in the data on all time frames at 51.25....that is first target for me
this is sellingtail from 10-22....high risk though
bingo...it is rare to see a gap in data that occurs in all time frames go unfilled...next targets for me 49-49.5 and 45-46
internals pretty average for an attempt to break all time highs so the short made a lot of sense as they are no big buyers helping them on this attempt
internals pretty average for an attempt to break all time highs so the short made a lot of sense as they are no big buyers helping them on this attempt
Originally posted by NickP
gap in the data on all time frames at 51.25....that is first target for me
came out heavy at target...good eyes Nick...trying to hold but not much ammo...we will either go back down to our 48 - 49 zone from here or we will make new contract highs above 54.50....so that is my one prediction for today and the 51.25 will decide how that plays out
that was my second scale at the 49-49.5....have a few left for 45-46 if they decide to push that much...entry was right at 53.5, right in that 53.5-54.5 zone i had marked on my chart...only trade for me today
i don't bruce....they are there because i have it on all my charts (just simple macd and rsi indicators) but i just don't pay attention to them...sorry
Originally posted by BruceM
nick can you explain how you u use your indicators in the lower panels...?Originally posted by NickP
here's what i am seeing
this looks poised for a breakout after nq keeps making all time highs...will be extra careful given taht it is friday and they proly want thte new all time high headlines on the 7 o' clock news !
Click image for original size
Emini Day Trading /
Daily Notes /
Forecast /
Economic Events /
Search /
Terms and Conditions /
Disclaimer /
Books /
Online Books /
Site Map /
Contact /
Privacy Policy /
Links /
About /
Day Trading Forum /
Investment Calculators /
Pivot Point Calculator /
Market Profile Generator /
Fibonacci Calculator /
Mailing List /
Advertise Here /
Articles /
Financial Terms /
Brokers /
Software /
Holidays /
Stock Split Calendar /
Mortgage Calculator /
Donate
Copyright © 2004-2023, MyPivots. All rights reserved.
Copyright © 2004-2023, MyPivots. All rights reserved.