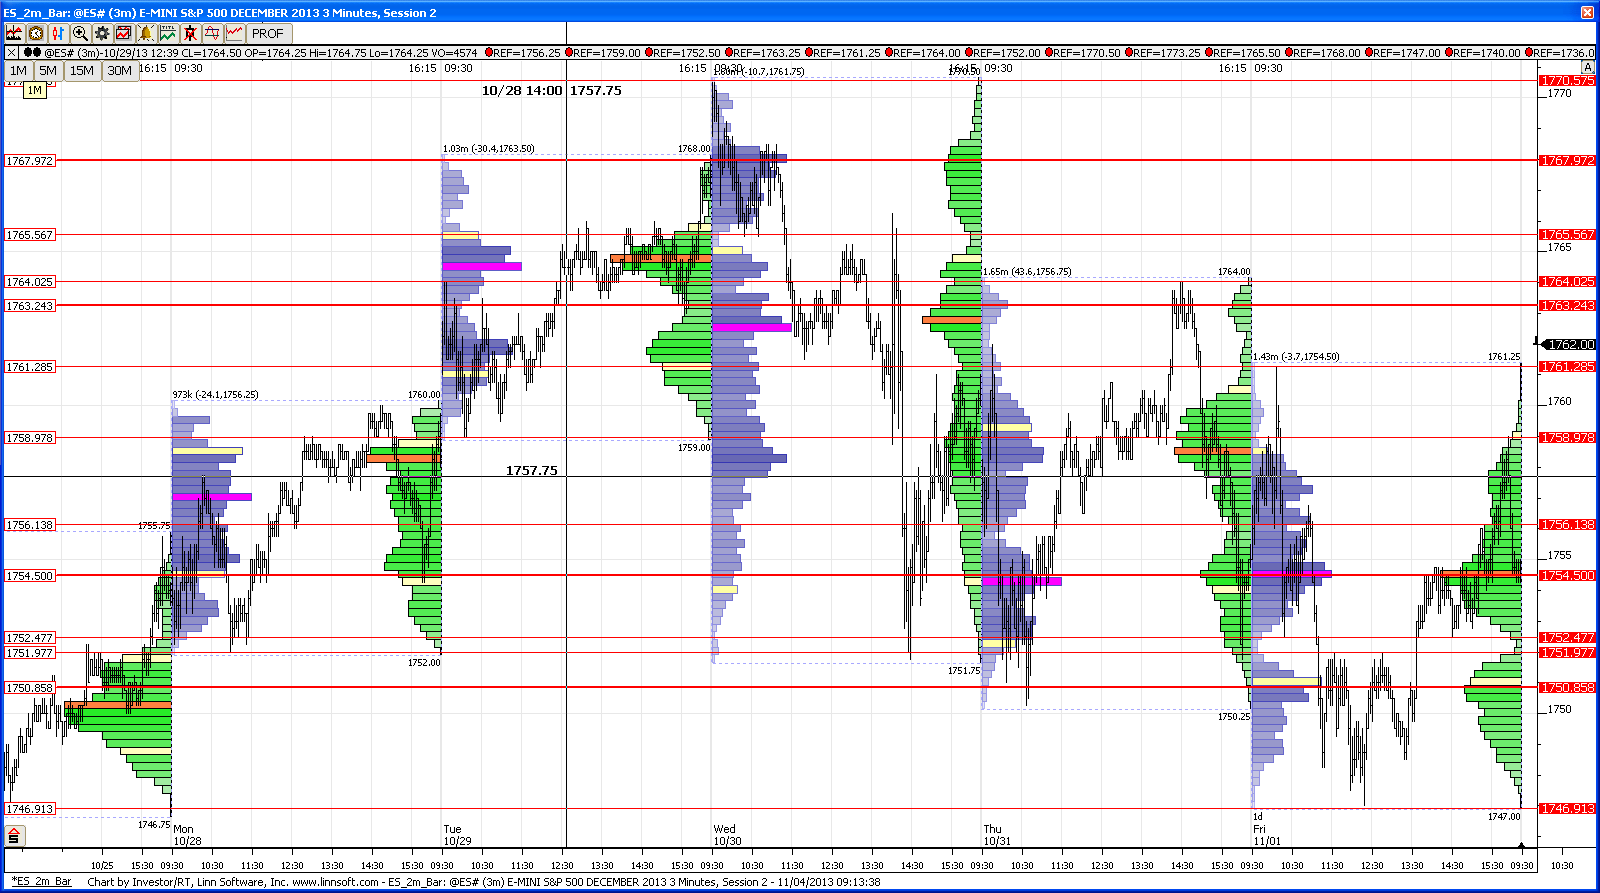
ES Monday 11-4-13
Kicking off Monday's trading chat with a tip to a much easier way to add charts/images to a forum post. I've added some instructions as a reply to the Screen Capture Software topic and here's a video showing it in action. Using this you should be able to grab an image and get it on the forum in seconds.
here are my levels coming into today...I didn't specifically say it on the video but R1 today is 61.75.....so 61.75 - 62.50 is my first resistance zone and then right above it is the more important 65.50.....the 58 - 59 will be the dividing line between last weeks high and low...many will use that to help them try to trade for the run of one of last weeks range extremes...
Bruce what make a weak high or low in your descriptions
those double tops Rburms...they just don't show a lot of impulse to get short quickly and aggressively like a selling tail does....nobody acted quickly....the concept is far from perfect though.....we have seen weak highs and lows stay in the market for quite some time...especially in summer trade..
aggressive traders can take shorts up here above the 61.75...ideally near 62.50.. but keep in mind they can still push up above that double top into 65.50 which is a better sell spot...then watch the 58 - 59 area as a first target
Thanks for the explanation Bruce
these markets seem dominated by short term traders and watching standard pivots can confirm that.....when big money is in the market they usually donot repsect simple things like the pivot levels based just off of the day session data and blow through them and all levels with ease...
beautiful as usual Nick !!
i'm selling above O/N highs
taking something at 60.50.....58 - 59 is key zone and possible support
Originally posted by rburns
guess that didnt work
Hey rburns - did you drag that into the quick reply text box at the bottom of the forum?
Emini Day Trading /
Daily Notes /
Forecast /
Economic Events /
Search /
Terms and Conditions /
Disclaimer /
Books /
Online Books /
Site Map /
Contact /
Privacy Policy /
Links /
About /
Day Trading Forum /
Investment Calculators /
Pivot Point Calculator /
Market Profile Generator /
Fibonacci Calculator /
Mailing List /
Advertise Here /
Articles /
Financial Terms /
Brokers /
Software /
Holidays /
Stock Split Calendar /
Mortgage Calculator /
Donate
Copyright © 2004-2023, MyPivots. All rights reserved.
Copyright © 2004-2023, MyPivots. All rights reserved.
