ES Tuesday 2-4-14
can't fit all of the day session charts as the range was too big and the view would be too small....hopefully this will work going into overnight and tomorrow.....lots of lines repeat or come close to help create the confluence areas
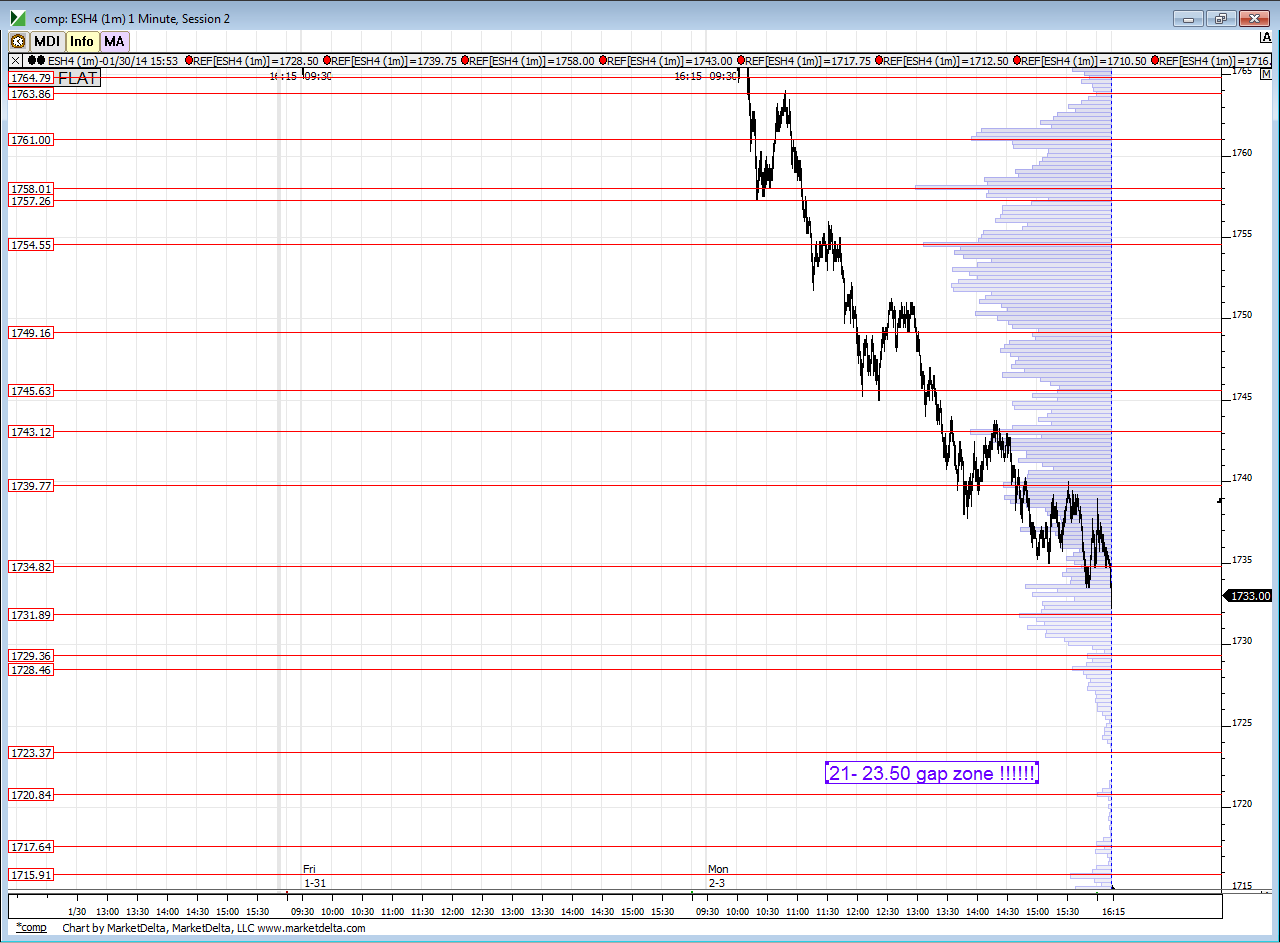
bigger picture composite chart first
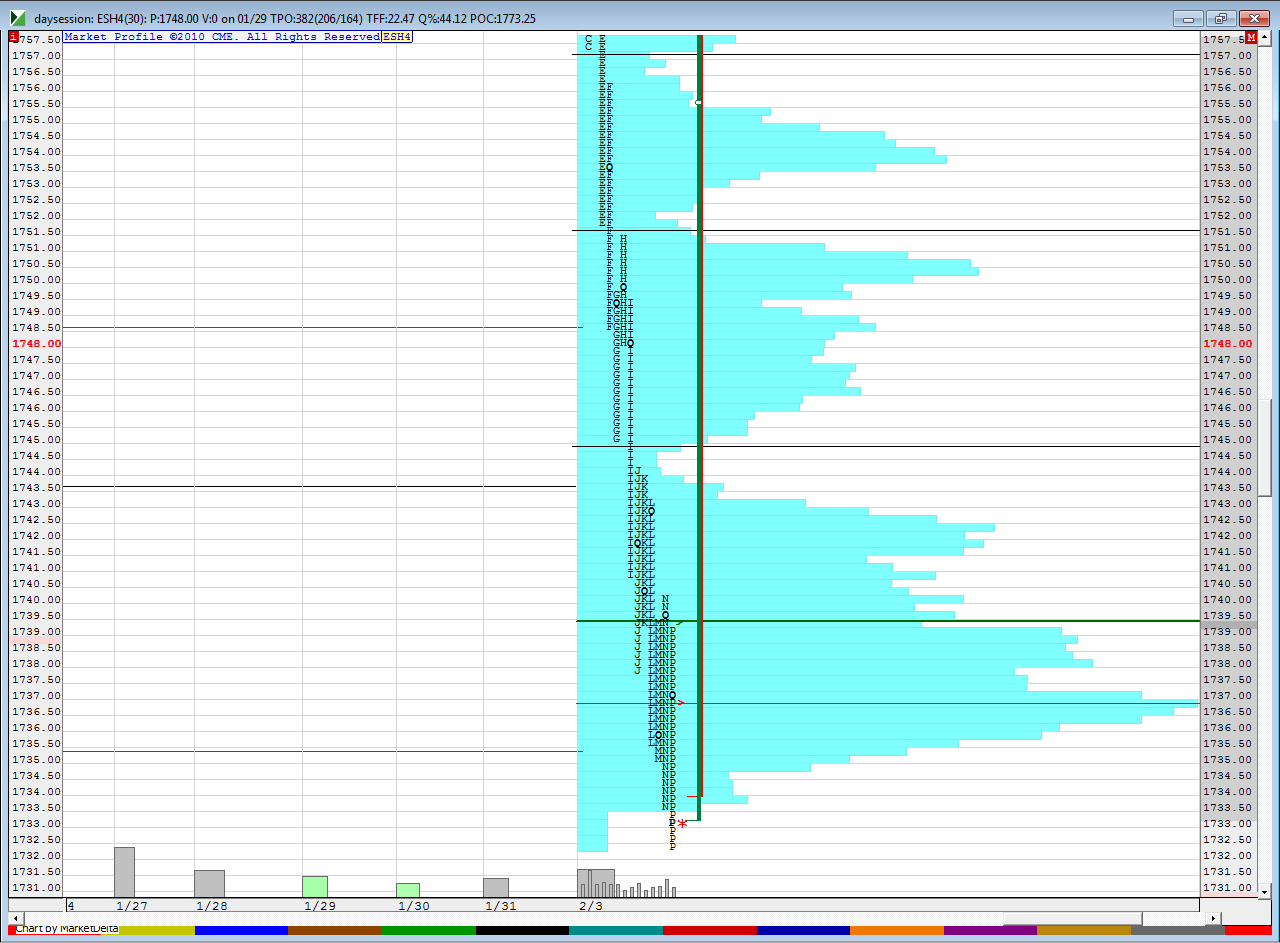
day session Mp chart - thin black lines are single prints
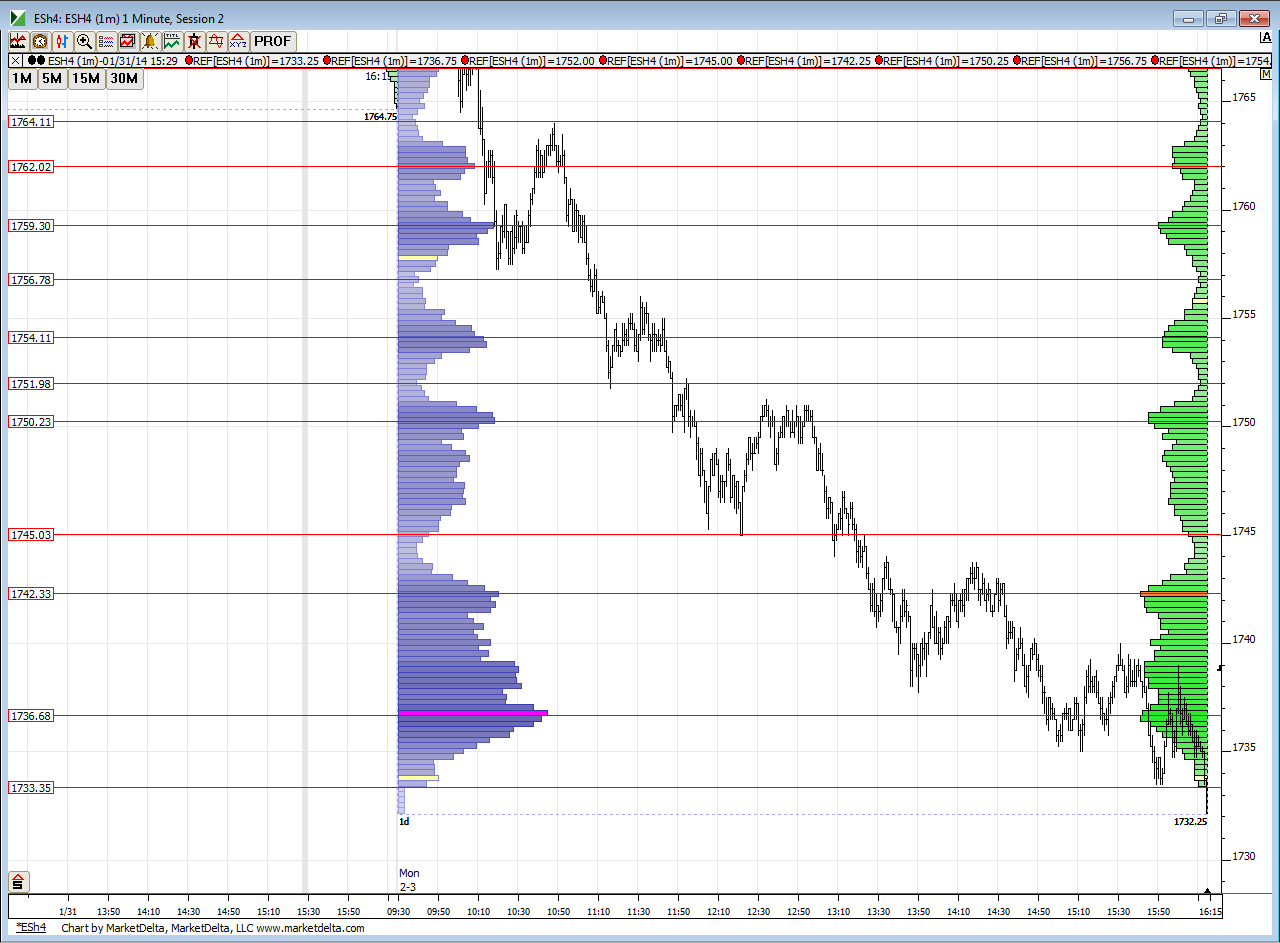
then my all inclusive chart to help find the key bell curves
Examples of how I would create zones : composite chart has an LTN at 49 and I have single prints at 51.50 so 49 - 51.50 becomes a zone...but the bell curve chart shows a LVN and LTN at 51.98 so I would make the zone 49 - 52
another example..composite chart has an HTN and an LTN price at 43.12 and 45.63 ...and we have single prints at 44.75 on the MP chart...so that becomes a zone...but the bell curve chart has a POC based on one minute at 42.33 ( see orange line on the right) so I would have to expand that zone a bit and probably make it 42.50 - 45.50...bigger volatility makes the zones wider so that makes sense
bigger picture composite chart first
Click image for original size
day session Mp chart - thin black lines are single prints
Click image for original size
then my all inclusive chart to help find the key bell curves
Click image for original size
Examples of how I would create zones : composite chart has an LTN at 49 and I have single prints at 51.50 so 49 - 51.50 becomes a zone...but the bell curve chart shows a LVN and LTN at 51.98 so I would make the zone 49 - 52
another example..composite chart has an HTN and an LTN price at 43.12 and 45.63 ...and we have single prints at 44.75 on the MP chart...so that becomes a zone...but the bell curve chart has a POC based on one minute at 42.33 ( see orange line on the right) so I would have to expand that zone a bit and probably make it 42.50 - 45.50...bigger volatility makes the zones wider so that makes sense
reason that i would use the 54.50 as a stop or awareness point- u can see on my third chart that started this thread..the esh4 chart ...the bulk in volume labeled at 54.11...and composite chart has 54.55....so you don't want much time spent above that.......unfortunately yesterday left a lot of these annoying little bell curves sticking out and that point is another center of a bell curve
you nail bruce..no trade or not.. nice
Emini Day Trading /
Daily Notes /
Forecast /
Economic Events /
Search /
Terms and Conditions /
Disclaimer /
Books /
Online Books /
Site Map /
Contact /
Privacy Policy /
Links /
About /
Day Trading Forum /
Investment Calculators /
Pivot Point Calculator /
Market Profile Generator /
Fibonacci Calculator /
Mailing List /
Advertise Here /
Articles /
Financial Terms /
Brokers /
Software /
Holidays /
Stock Split Calendar /
Mortgage Calculator /
Donate
Copyright © 2004-2023, MyPivots. All rights reserved.
Copyright © 2004-2023, MyPivots. All rights reserved.