ES Tuesday 9-1-15
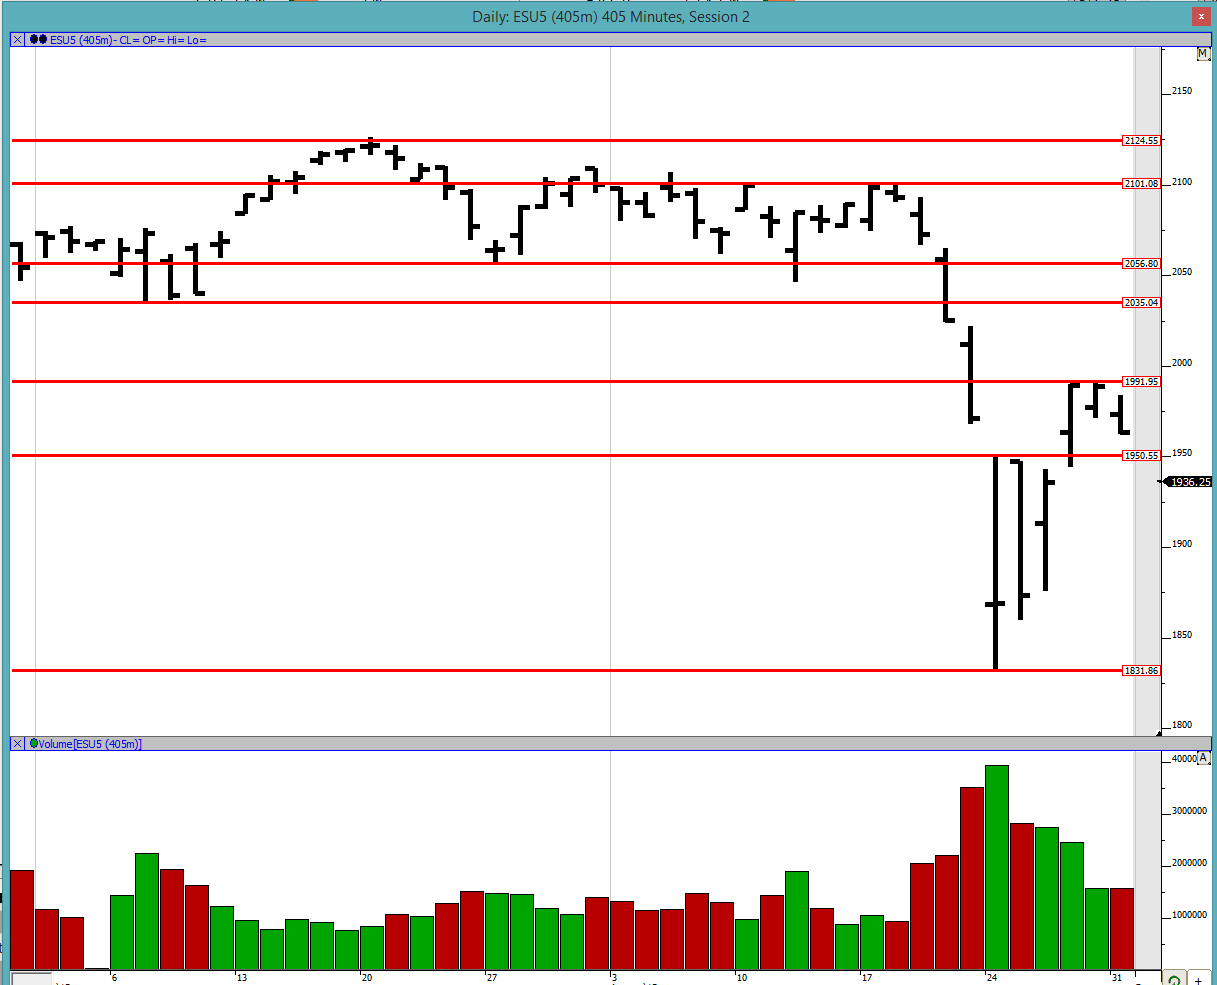
Good evening to all. It appears that we are now in another 3-day balance with 8/27, 8/28 and 8/31. The previous balance area's high (1950.5) continues to be of interest to me. We either look below the current balance area and continue lower (which would take us to the previous balance area low of 1831.75) or we look below and fail, pushing us to the current balance area high of 1992. Same goes the other way as well. Let us leave it as simple as that for now.
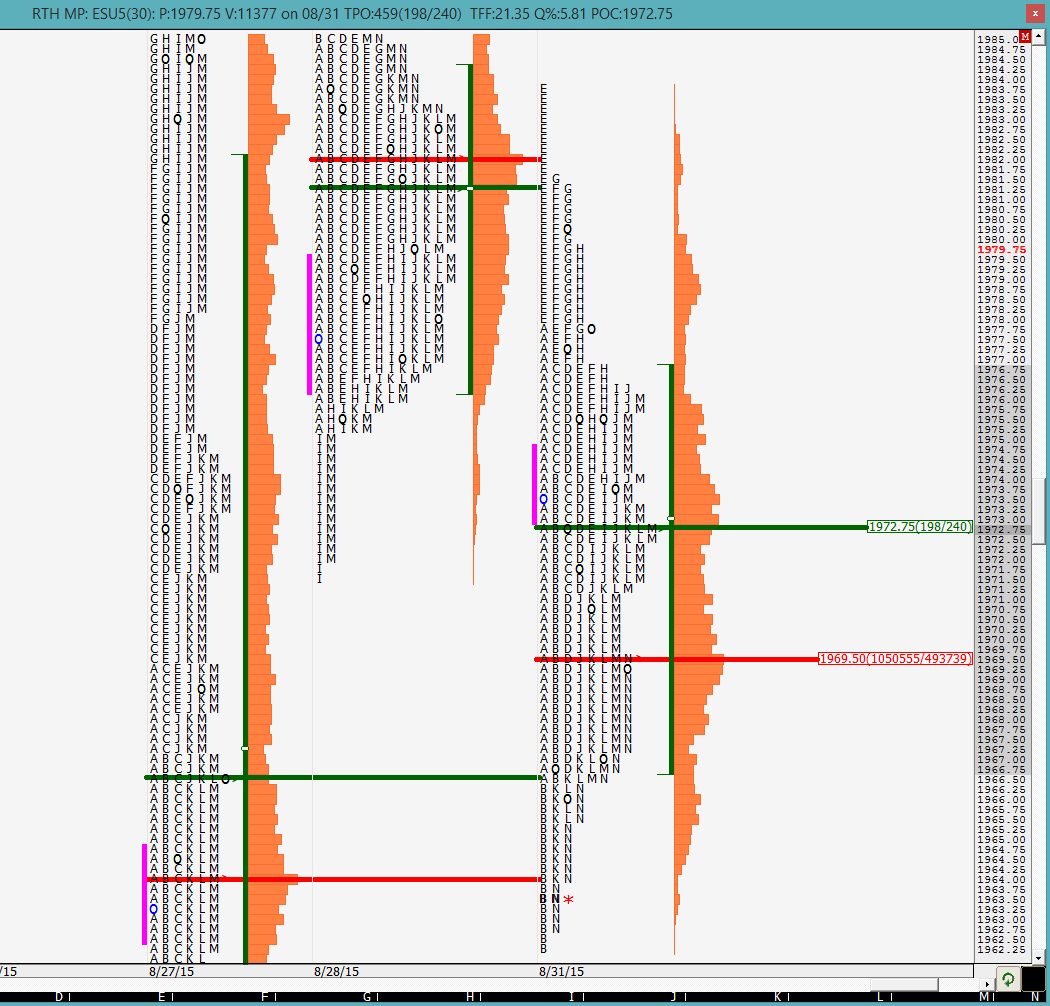
Greenies: 1894, 1969.5, 1979, 1995, 2014.25, 2053.25, 2077.75
Profile:
Monday looked like another balancing day but it appeared to be weaker. We see that we have a fairly prominent POC at 1972.75 and a VPOC at 1969.5. There is a good selling tail at the highs but the lows look a little suspicious with only a 2-tick buying tail. Monday again had a lot of back and forth action but closed weak with the close being towards the low of the day and outside of 8/28's range. Now we see if we get to 1831 by continuing lower, go higher and break through 1992 or continue balancing.
The split profile shows the back and forth action with the highs and lows being bookended by previous greenies. This means that the market is still trying to decide on what to do and neither the buyers nor sellers have much conviction. The next naked VPOC on the downside is at 1894 i.e. a greenie. Lots of single prints and thin profile on the way down so things could get volatile again. Stay alert.
Currently the markets have sold off rather hard and we shall see if the European open has any impact on it or not. As of right now we would be below the 1950.5 level so if this continues until the RTH open and if there is no buying support at the open, things could get ugly and 1894 and 1831 could very well be in play. We shall see how the O/N performs and come up with a game plan in the AM. Good luck to all.
Greenies: 1894, 1969.5, 1979, 1995, 2014.25, 2053.25, 2077.75
Click image for original size
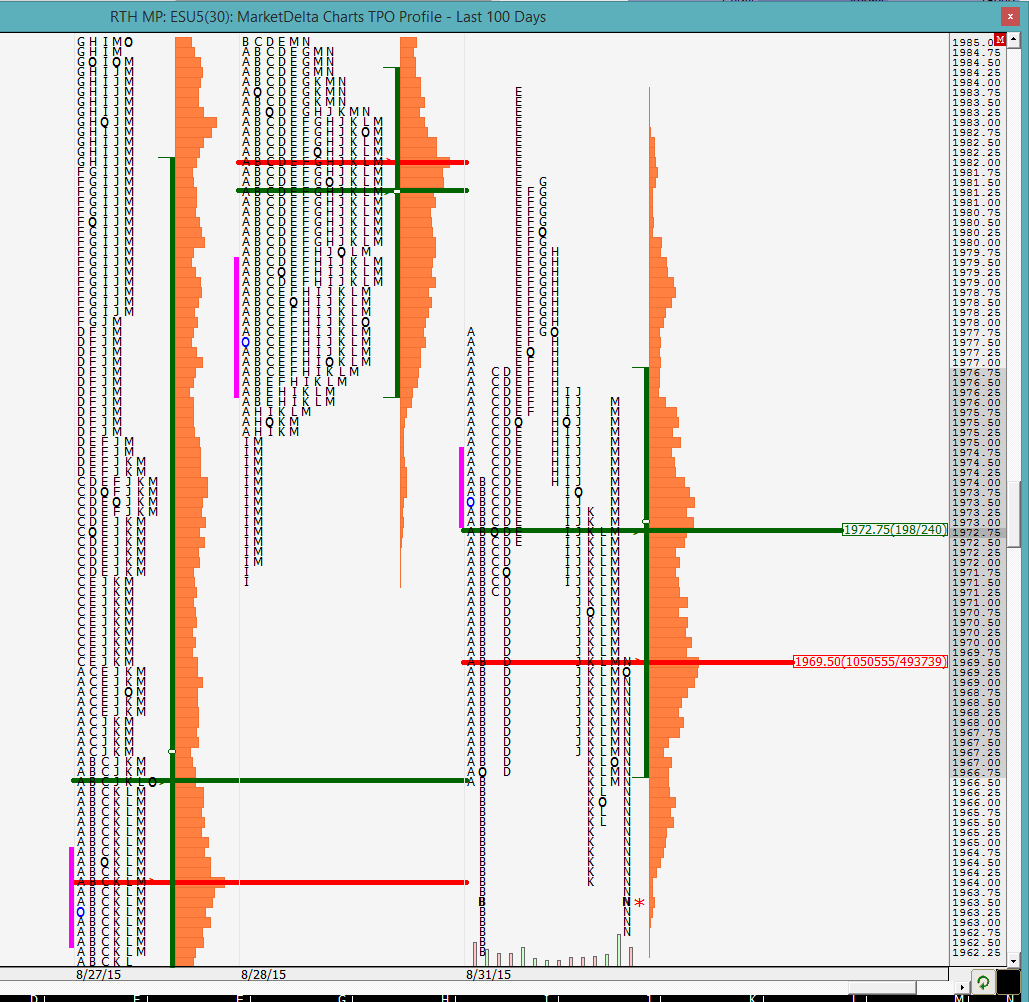
Profile:
Monday looked like another balancing day but it appeared to be weaker. We see that we have a fairly prominent POC at 1972.75 and a VPOC at 1969.5. There is a good selling tail at the highs but the lows look a little suspicious with only a 2-tick buying tail. Monday again had a lot of back and forth action but closed weak with the close being towards the low of the day and outside of 8/28's range. Now we see if we get to 1831 by continuing lower, go higher and break through 1992 or continue balancing.
Click image for original size
The split profile shows the back and forth action with the highs and lows being bookended by previous greenies. This means that the market is still trying to decide on what to do and neither the buyers nor sellers have much conviction. The next naked VPOC on the downside is at 1894 i.e. a greenie. Lots of single prints and thin profile on the way down so things could get volatile again. Stay alert.
Click image for original size
Currently the markets have sold off rather hard and we shall see if the European open has any impact on it or not. As of right now we would be below the 1950.5 level so if this continues until the RTH open and if there is no buying support at the open, things could get ugly and 1894 and 1831 could very well be in play. We shall see how the O/N performs and come up with a game plan in the AM. Good luck to all.
the O/N market is clearly 100% net short and the selling has not ceased since the opening. we are now inside 8/26's range and within the single prints from 1918 to 1923.25. Single prints also exist from 1932.5 to 1934.5 and 1940.75 to 1943. We shall see how the market reacts at RTH open. The 1894 greenie was the VPOC of 8/26 and could possibly be on the radar. Volatility still reigns so continue to be alert. Good luck to all.
we are inside the previous balance area that extended from 1831 to 1950.5. On RTH open if we do not get outside it quickly, then the possibility exists of going to the other end at 1831 so the moves could be fast
we are seeing some inventory adjustment at the open. the O/N mid-pt is at 1940 and O/N single prints from 1947.25 to 1953.25
30 min VPOC at 1930, almost the mid-pt so far
looks like there were 2 trades so far: 1. buying around the open based on short covering and 2. selling into the 1938 (o/n POC) - 1940 (o/n mid) zone.
the trades themselves depend on one's trading style. i have seen traders trade a lot of different styles and as long as you can make your style work, thats good for you. that is something i personally struggle with as well with regards to identifying my trading style. it is still a work in progress.
but you are right, if that is your trading style, then those were viable trades
but you are right, if that is your trading style, then those were viable trades
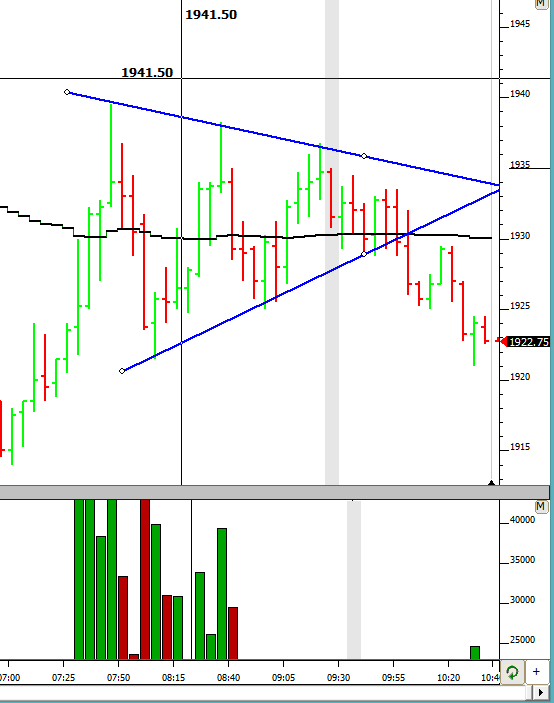
market is balancing right now but i do not think this lasts the day. there will be a breakout at some point either to the upside or downside and it will likely be sustained
here is something different. this is a 5-min chart and we can see that we are coiling into a wedge so the expectation is a breakout at some point. the indicator is VWAP.
will show a follow up picture later to see how it works out. i will not move the trend lines and see what happens
will show a follow up picture later to see how it works out. i will not move the trend lines and see what happens
Click image for original size
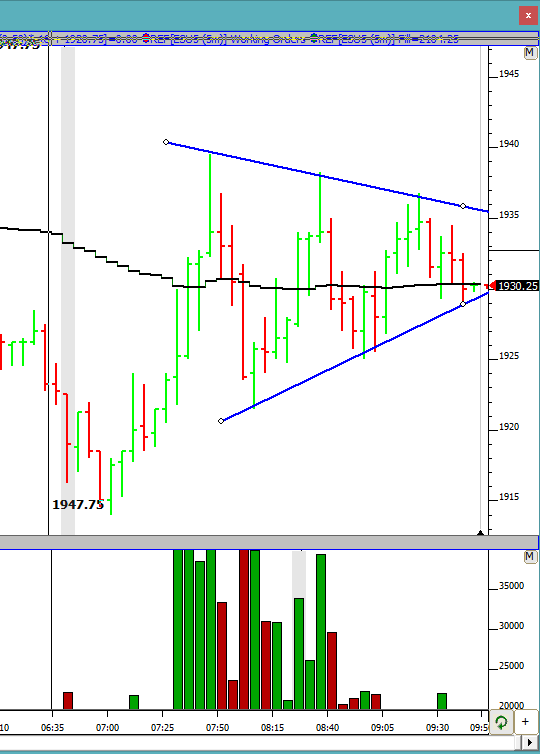
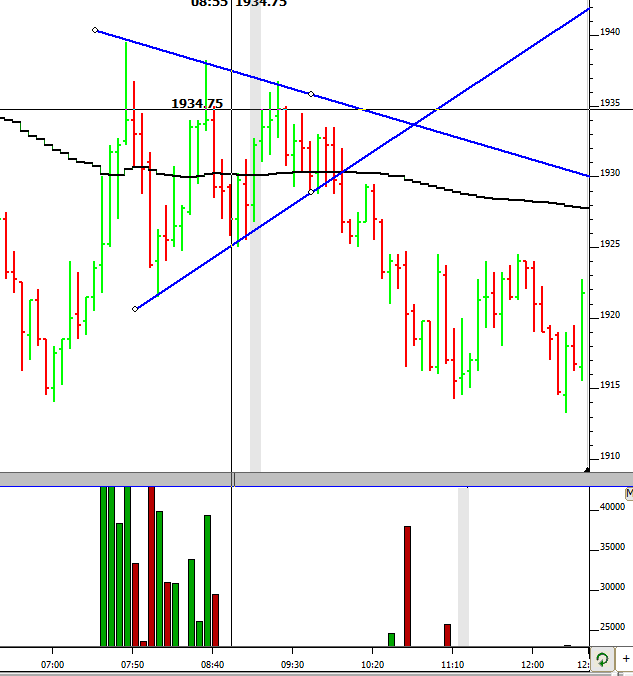
here is how the wedge breakout played out
Click image for original size
Here is the final picture of the wedge. Ignore the trend lines after they cross each other because the way i drew them, they were auto-extending. we can see that prices reached the VWAP and were rejected below the bottom of the wedge giving a pretty picture perfect setup. we will see how this showed up in the profile in the prep for tomorrow
Click image for original size
Emini Day Trading /
Daily Notes /
Forecast /
Economic Events /
Search /
Terms and Conditions /
Disclaimer /
Books /
Online Books /
Site Map /
Contact /
Privacy Policy /
Links /
About /
Day Trading Forum /
Investment Calculators /
Pivot Point Calculator /
Market Profile Generator /
Fibonacci Calculator /
Mailing List /
Advertise Here /
Articles /
Financial Terms /
Brokers /
Software /
Holidays /
Stock Split Calendar /
Mortgage Calculator /
Donate
Copyright © 2004-2023, MyPivots. All rights reserved.
Copyright © 2004-2023, MyPivots. All rights reserved.