ES Wednesday 5-11-16
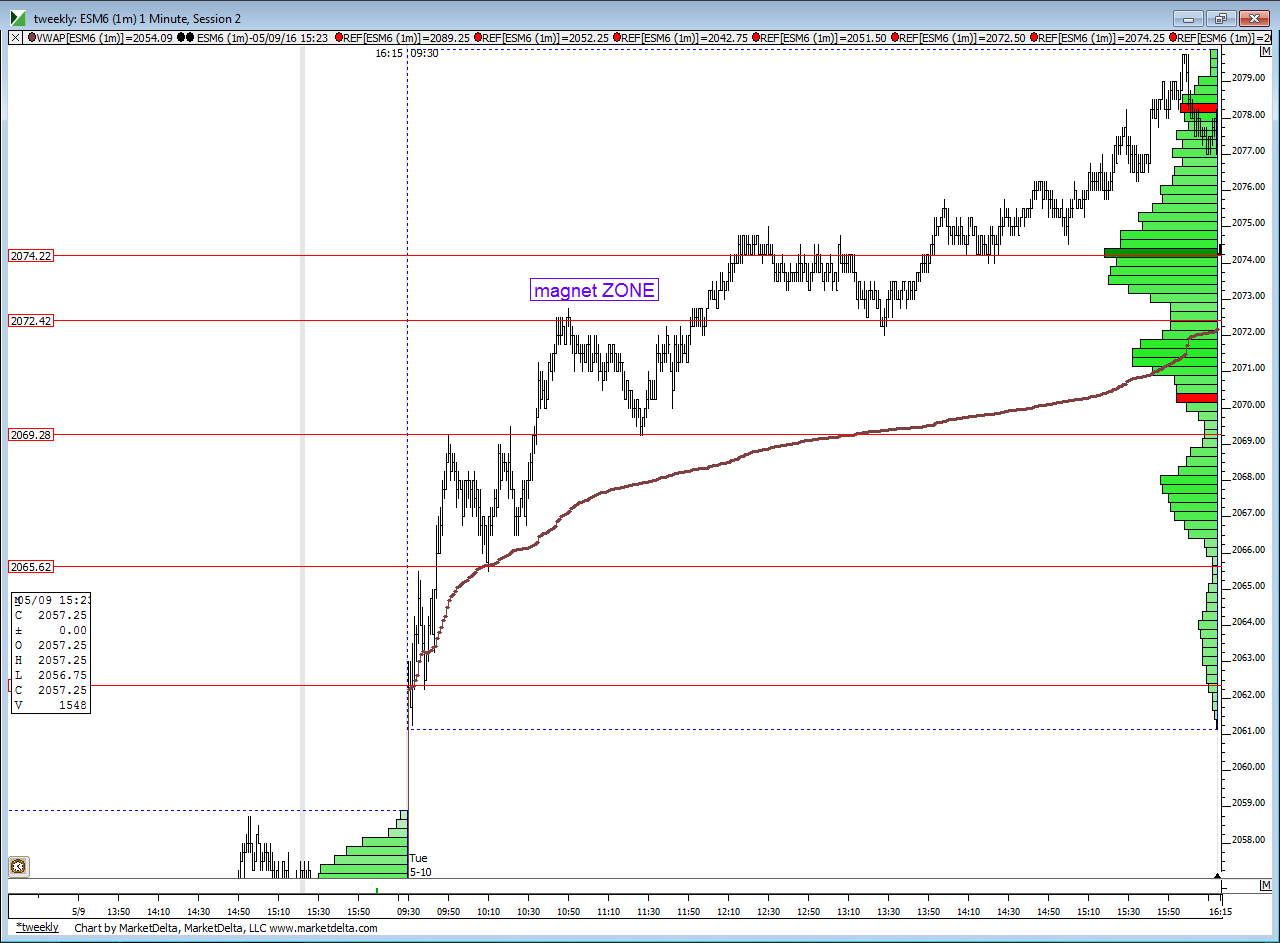
rearranged some things to trade for Overnight midpoint...started at 76 print in overnight and using 74 as target....entire 72.50 - 74 is magnet zone in early trade.pivot is at 73 .here is price action chart...Overnight low at 69 area goes well with low time from YD...other area of confluence are 85 - 86.50...poor high on yesterdays profile too...will edit to add some charts
price action chart. note how YD was a series of 3 - 4 different bell curves
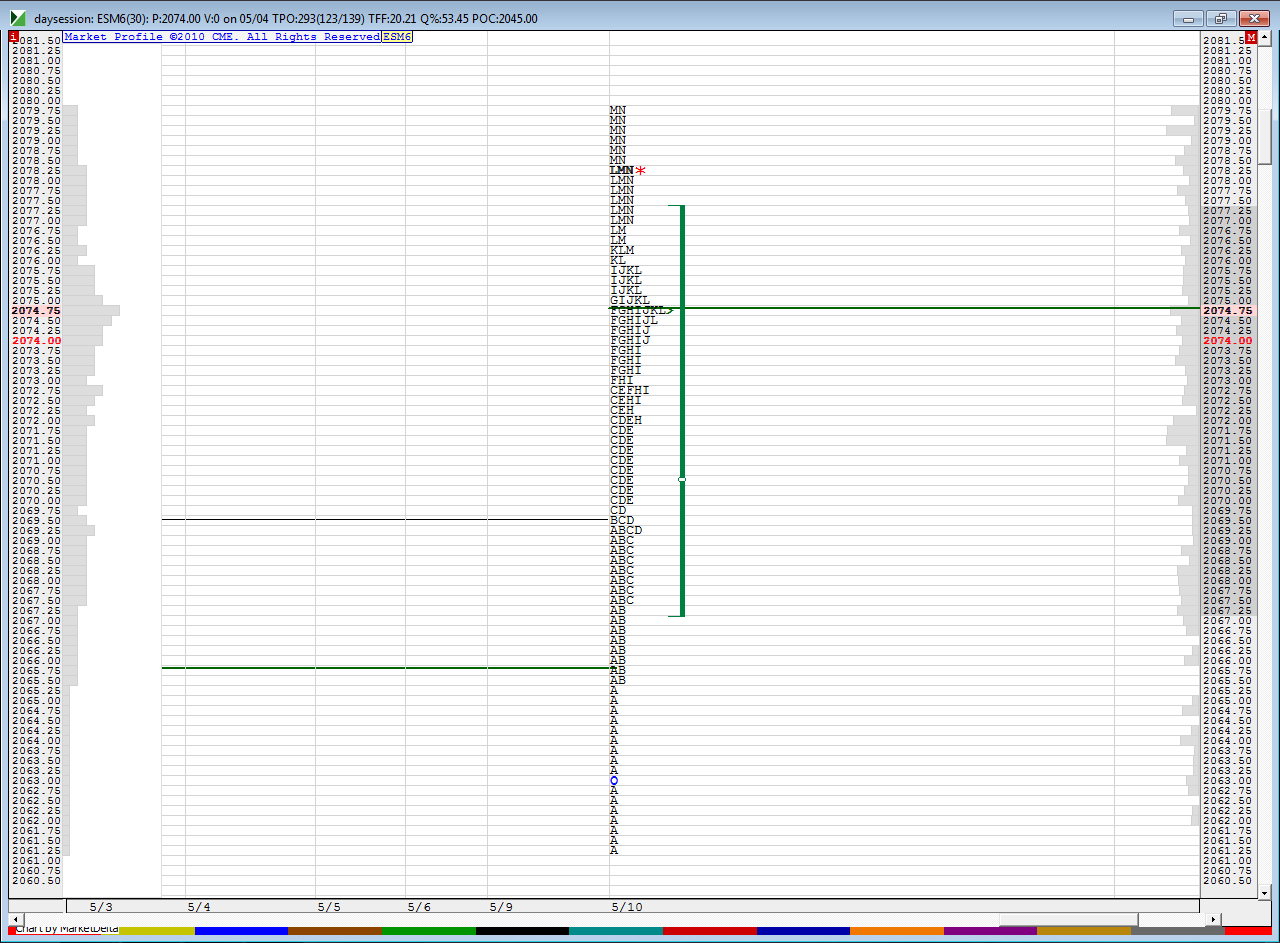
yesterdays profile..note annomolies at "I, H and D"...a sloppy profile....and matching prints at the "M,N" high
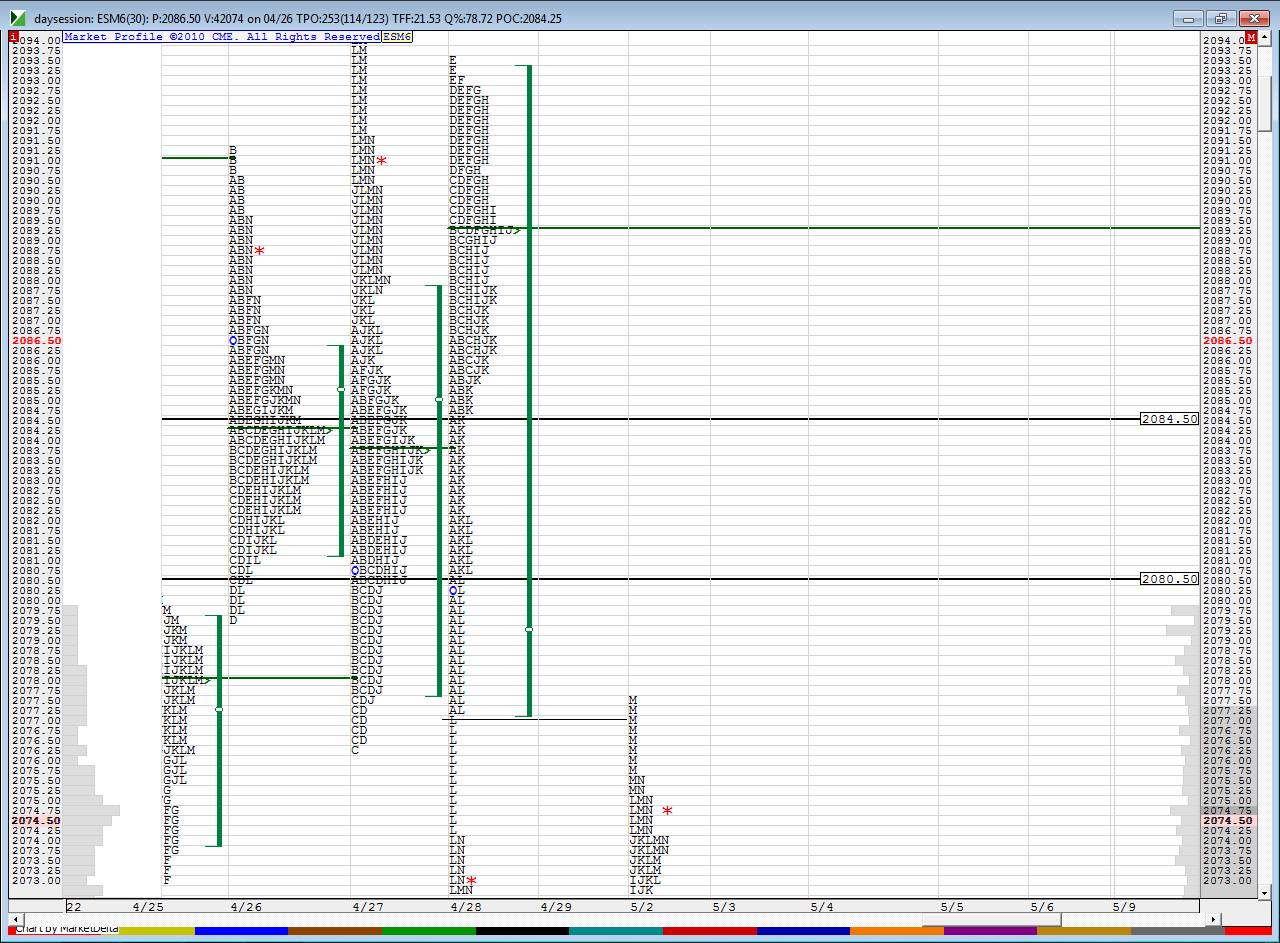
and a look at what is above YD highs if they push
we have low tpo's at 80.50 and then again at 84.50.....R1 is 85 today and 1/2 SD band up is 86.50...so 84.50 - 86.50 is a good upper zone..
It will be interesting if they can actually push to one of the daily SITYS zones at 86.50 or 71.75...my money is on the 71.75 test
price action chart. note how YD was a series of 3 - 4 different bell curves
Click image for original size
yesterdays profile..note annomolies at "I, H and D"...a sloppy profile....and matching prints at the "M,N" high
Click image for original size
and a look at what is above YD highs if they push
we have low tpo's at 80.50 and then again at 84.50.....R1 is 85 today and 1/2 SD band up is 86.50...so 84.50 - 86.50 is a good upper zone..
It will be interesting if they can actually push to one of the daily SITYS zones at 86.50 or 71.75...my money is on the 71.75 test
Click image for original size
YD's VPOC was at 71.5 as well. So expect some congestion in the low 70s area that Bruce mentioned
I'll be selling the open as long as it is above the O/N midpoint and would like to get to that 71.75 SITYS number eventually but won't be stubborn about it....overnight inventory was short so we may get the pop up first...I hope that happens to set up RTH sells for O/N midpoint
I'm done at 71.75 the SITYS number....I think we didn't get much opportunity with the midpoint today...I would have preferred an open above or below the midpoint but we opened right at the midpoint so that limited things...the only thing that helped a bit is that we had two swing highs in the Overnight at 76 for some reason and we traded so often through the magnet zone in overnight...so I was thinking that we might keep doing that....having the SITYS number below helped on the shorts but still not the best setups today
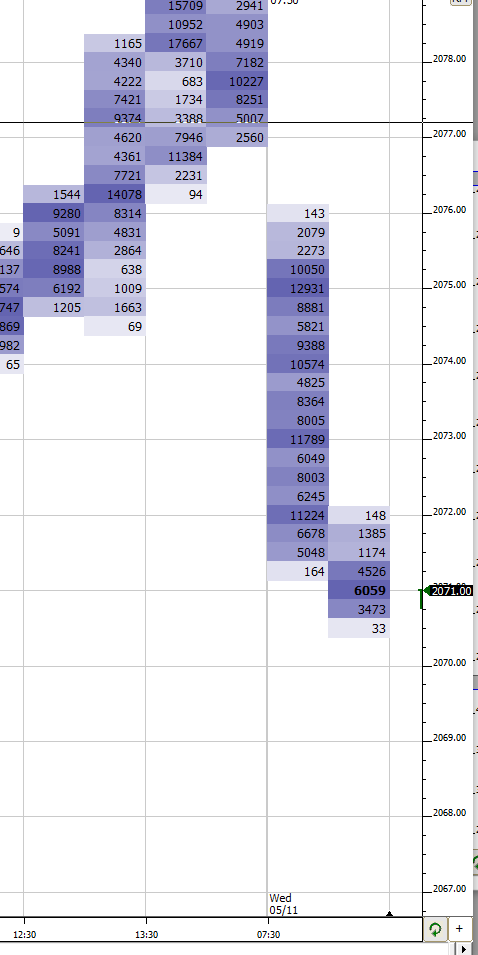
30 min VPOC at 75 but I am not putting much weight into it because look at all those 11k volume numbers all over the map. So not much value in it. I am starting to put more value in the 30-min VPOC when the volume is clearly larger than at other prices. Else discount it.
Click image for original size
notice how they can't hold trade outside of last weeks highs so far today .....this might imply larger and longer term traders aren't interested and everyone got "too long" yesterday to quote Dalton and those double tpo's at yesterdays high might be another clue ...
a great example today as to why you need to be careful with the Overnight high and low probability....THEY KNOW you want that as a target...so today they bring to to withinn two tics of the O/N high and sell it off to get the O/N low.....sneaky SOB's
a great example today as to why you need to be careful with the Overnight high and low probability....THEY KNOW you want that as a target...so today they bring to to withinn two tics of the O/N high and sell it off to get the O/N low.....sneaky SOB's
Bruce, I know that you have mentioned IB before and I know ft71 quotes some stats on it but can you give us a quick version of some stats on IB? I am not sure if that is related to IBH/IBL or leaving singles behind, etc but a refresher on your IB knowledge would be helpful
sellers now would need to keep this under the magnet zone of 72 - 74...how many times are they gonna go through and back to that today...I couldn't trade this...just too many conflicts...I can't be sure if they want to go back up to that zone or roll it over down to 2065....
I don't do too much with the Ib anymore as I am not usually trading much past 11 a.m most days but all I really ever follow is the concept that breakouts or breakdowns from the IB that leave singles behind have the lowest odds of remaining as single prints for the entire day....so at some point they get filled in....the highest odds of having a good breakout/down come from the 30 minute range and then behind that is the 90 minute range.....you also don't usually see two sets of single prints off of any of the 30, 60 or 90 minute ranges without having any of those get filled in......just a low probability to push in one direction for so long and keep going for the rest of the day
Originally posted by NewKid
Bruce, I know that you have mentioned IB before and I know ft71 quotes some stats on it but can you give us a quick version of some stats on IB? I am not sure if that is related to IBH/IBL or leaving singles behind, etc but a refresher on your IB knowledge would be helpful
Thanks!
Originally posted by BruceM
I don't do too much with the Ib anymore as I am not usually trading much past 11 a.m most days but all I really ever follow is the concept that breakouts or breakdowns from the IB that leave singles behind have the lowest odds of remaining as single prints for the entire day....so at some point they get filled in....the highest odds of having a good breakout/down come from the 30 minute range and then behind that is the 90 minute range.....you also don't usually see two sets of single prints off of any of the 30, 60 or 90 minute ranges without having any of those get filled in......just a low probability to push in one direction for so long and keep going for the rest of the dayOriginally posted by NewKid
Bruce, I know that you have mentioned IB before and I know ft71 quotes some stats on it but can you give us a quick version of some stats on IB? I am not sure if that is related to IBH/IBL or leaving singles behind, etc but a refresher on your IB knowledge would be helpful
VPOC shifted to 72...
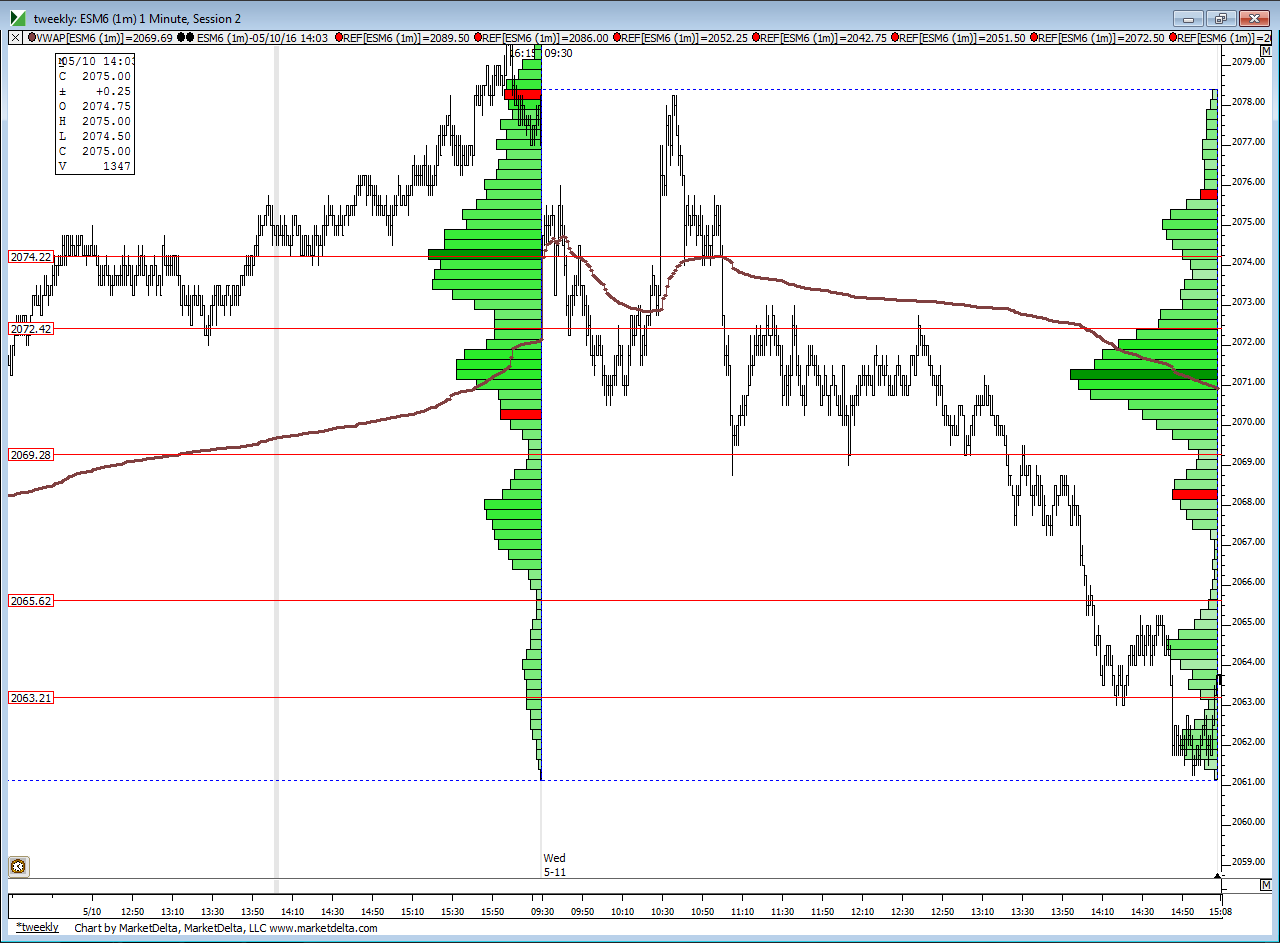
here's how the lines played out...these are from Yesterday on today's chart..I have yet to snap new lines from today chart as over an hour left in RTH so they are the same ones posted above in post one....expecting a possible pop up ( a bit of one ) to unfold as One SD band down comes in at 2064 today....so 16 % of the time we will close below there...not trading it...just happen to stop by the computer...good luck late day traders...I think many would want to see them push it back up into the 67 area but what do I know..? me and late day trades don't go too well!
Click image for original size
Emini Day Trading /
Daily Notes /
Forecast /
Economic Events /
Search /
Terms and Conditions /
Disclaimer /
Books /
Online Books /
Site Map /
Contact /
Privacy Policy /
Links /
About /
Day Trading Forum /
Investment Calculators /
Pivot Point Calculator /
Market Profile Generator /
Fibonacci Calculator /
Mailing List /
Advertise Here /
Articles /
Financial Terms /
Brokers /
Software /
Holidays /
Stock Split Calendar /
Mortgage Calculator /
Donate
Copyright © 2004-2023, MyPivots. All rights reserved.
Copyright © 2004-2023, MyPivots. All rights reserved.