ES Monday 6-27-16
Weakness of Friday has spilled into Monday already.
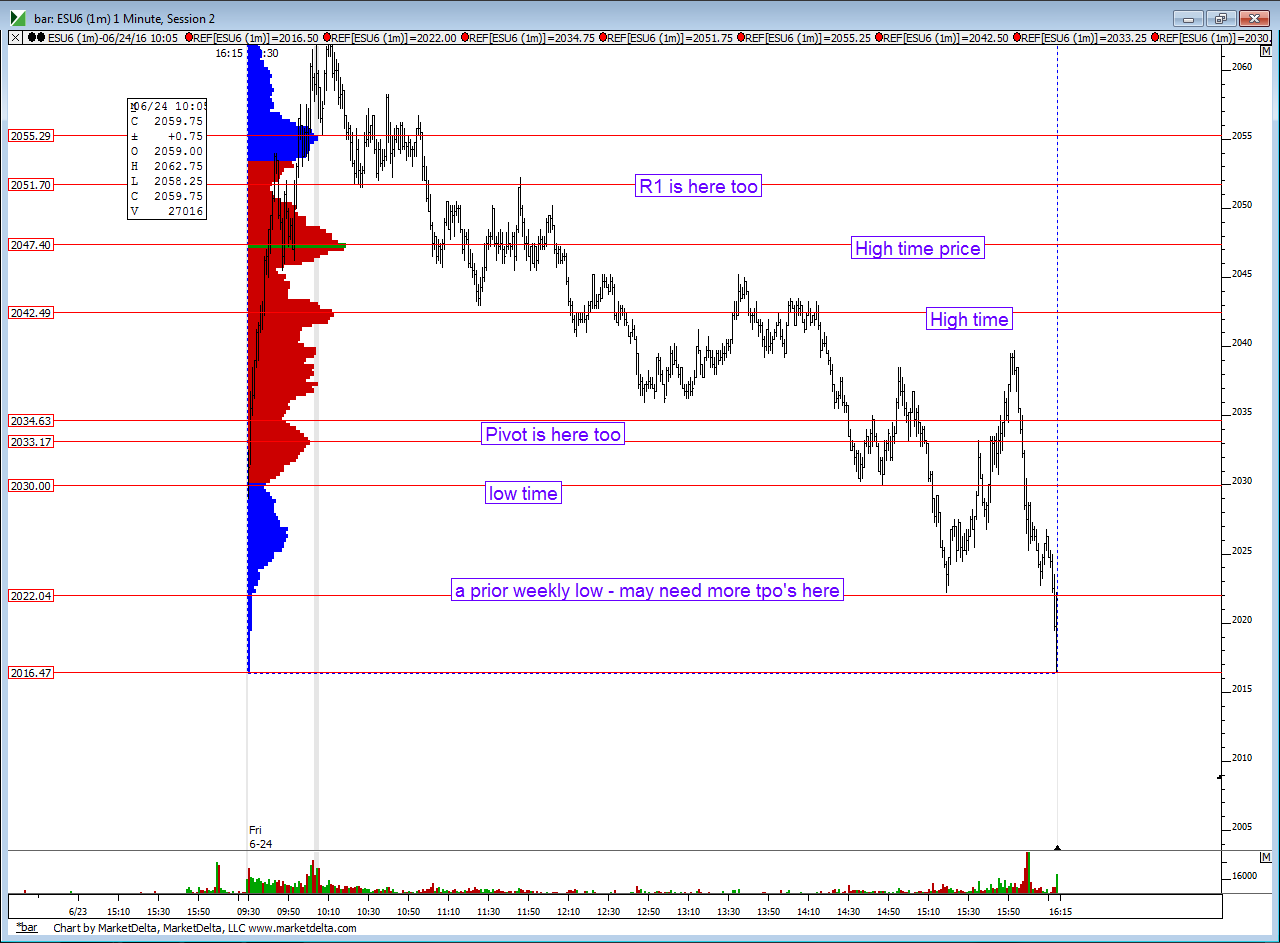
Overnight high goes well with 4:15 close of Friday at 2022 and this is a prior weeks low. I generally like to see multiple tpo's at weekly breakout or breakdown points..
European open goes well with Friday lows at 2016 so using 2014 - 2016 as an area. We also have a daily swing low from 5-19 here !
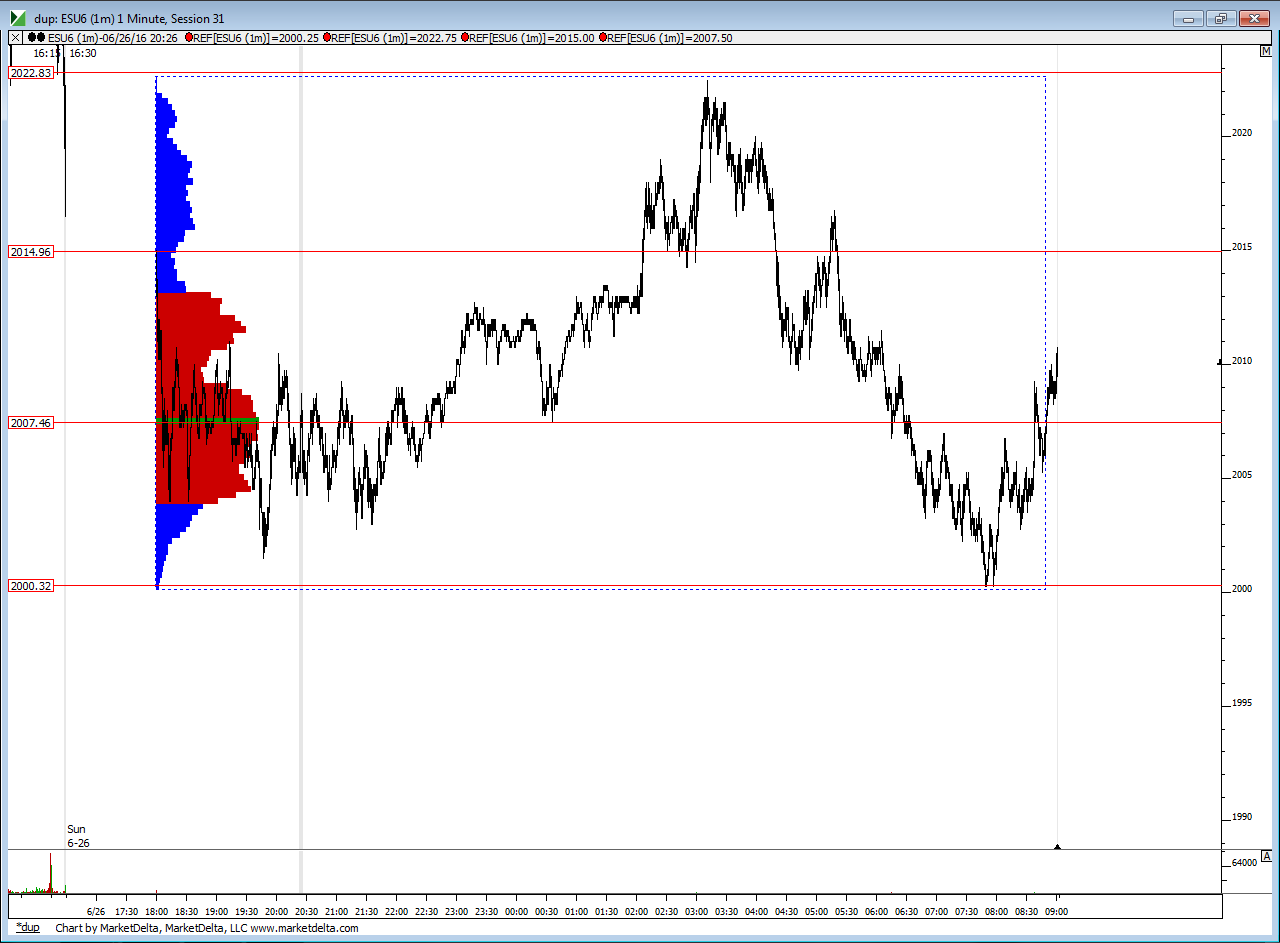
besides the overnight low as a reference I will be using 2007.50 as a possible magnet...lots of volume in the overnight has passed through this point !
S1 today is at 2004.25 so many will be using 2004.25 - 2007.50 as a bigger bull bear line .
Here is Friday with the most relevant lines.....we are set to open out of this range so I will include the overnight too and edit this post.
overnight as I type
a longer term idea...generally we hit some weekly floor trader number also about 95 % of the time ....we will be opening between the weekly pivot of 2048 and the s1 at 1989.75 ( daily s2 is at 1986 for confluence should we drop down there today) so the probability says that by weeks end one of those will print...may or may not be useful to some reading this
I really like the idea of trading to the long side today especially if we open under last weeks lows....that would put us breaking down from TWO weekly lows as we broke down from the 2022 low late on Friday and I think they may need to know about that some more but also we will be opening under last weeks lows of 2016.....so odds favor a retest up to check out at least one of those areas. I will be using 2007.50 and 2004.25 as my POSSIBLE support points to get long. If you take the 2004 area then obviously you need to scale something at the 2007 area just in case it becomes resistance. If you take the 2007.50 then scale at the weekly low from back in March at the 2011.50 area just in case that becomes resistance too...so lets not be pigs just because ranges are bigger...u can see this area as a spot on my overnight chart that I didn't mark...but time has been trading back and forth there
Overnight high goes well with 4:15 close of Friday at 2022 and this is a prior weeks low. I generally like to see multiple tpo's at weekly breakout or breakdown points..
European open goes well with Friday lows at 2016 so using 2014 - 2016 as an area. We also have a daily swing low from 5-19 here !
besides the overnight low as a reference I will be using 2007.50 as a possible magnet...lots of volume in the overnight has passed through this point !
S1 today is at 2004.25 so many will be using 2004.25 - 2007.50 as a bigger bull bear line .
Here is Friday with the most relevant lines.....we are set to open out of this range so I will include the overnight too and edit this post.
Click image for original size
overnight as I type
Click image for original size
a longer term idea...generally we hit some weekly floor trader number also about 95 % of the time ....we will be opening between the weekly pivot of 2048 and the s1 at 1989.75 ( daily s2 is at 1986 for confluence should we drop down there today) so the probability says that by weeks end one of those will print...may or may not be useful to some reading this
I really like the idea of trading to the long side today especially if we open under last weeks lows....that would put us breaking down from TWO weekly lows as we broke down from the 2022 low late on Friday and I think they may need to know about that some more but also we will be opening under last weeks lows of 2016.....so odds favor a retest up to check out at least one of those areas. I will be using 2007.50 and 2004.25 as my POSSIBLE support points to get long. If you take the 2004 area then obviously you need to scale something at the 2007 area just in case it becomes resistance. If you take the 2007.50 then scale at the weekly low from back in March at the 2011.50 area just in case that becomes resistance too...so lets not be pigs just because ranges are bigger...u can see this area as a spot on my overnight chart that I didn't mark...but time has been trading back and forth there
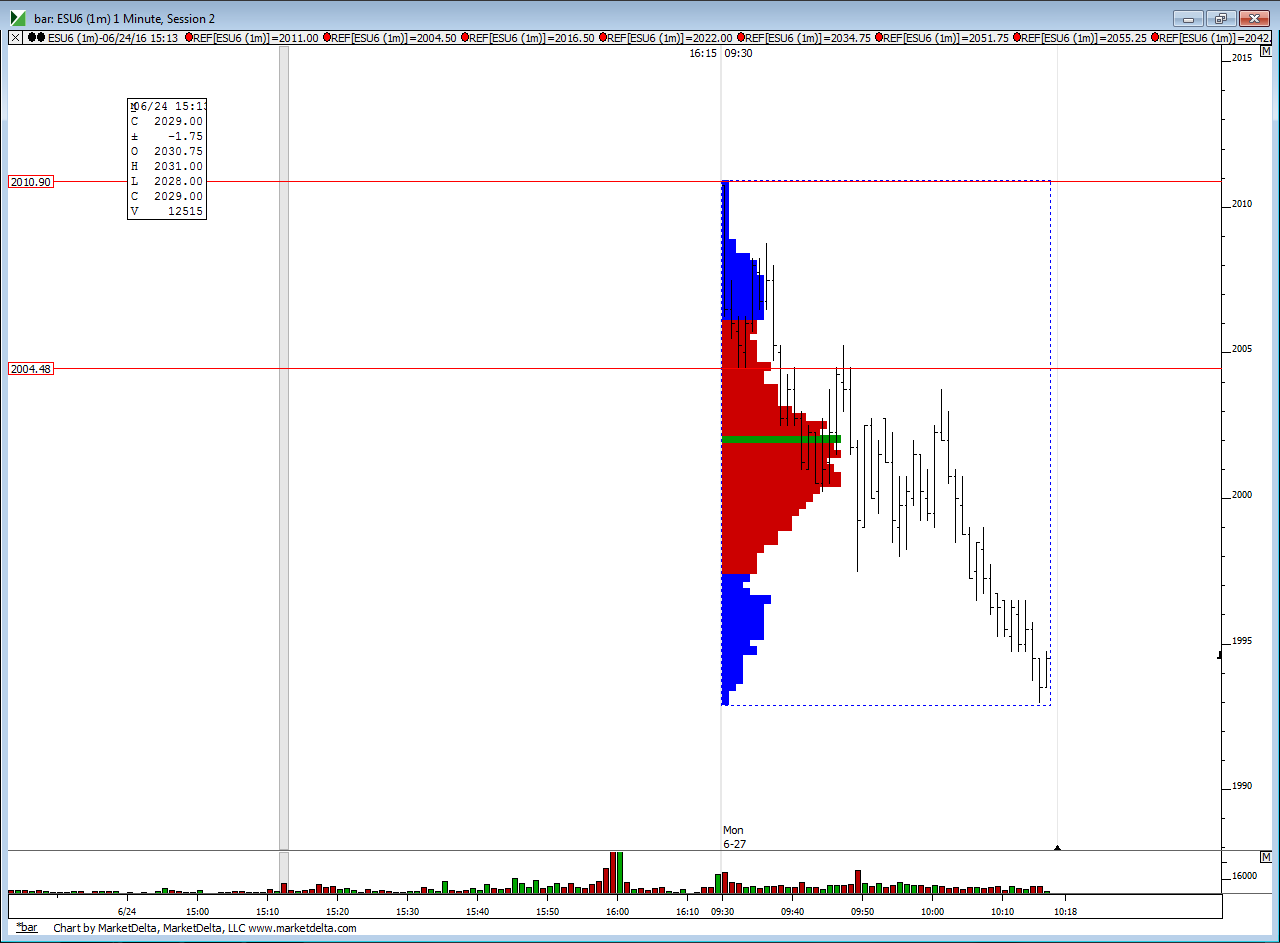
no midpoint yet...mondays and friday's seem to have the most failures of those but if you find a good long then it is still on the table..market is dropping now so we can try Overnight low so using 1998 - 2000 as an additional spot....the 2004.50 trade already played out ( back to the 2007.50 magnet )....we could also try again wait to see if price can get back above the S1 level and firm up and then try for midpoint again but that is from higher prices...
Long trades taken near overnight lows would need to be mindful of that 2004 area again
Long trades taken near overnight lows would need to be mindful of that 2004 area again
very cool...but damn this is hard to trade and type...what I was trying to say in last post was that a more conservative trader could wait till we firm up above the daily s1 area of 2004.25 and still try for midpoint.......hard to keep thoughts connected to words and what is typed sometimes ( quite often actually)when in a trade
this is three pushes down and last one had high volume...I'd like to see us start firming up now and try one last long to see if I can get something to really "Run" and "stick"
a frantic video and my mistake on the 2022 area....had a data issue and messed up on that area but we have many weekly lows above so buying calls.....video ramble when u have time and desire to listen.
well we have new lows...all the time today is spent at 2001 which is damn close to O/N low so that is the line that we would need to see price firm up above at.....many will be trying to buy under the 1997 swing exepcting price to push back to 2001...I'm sure vpoc must be near there on 30 minute too....only concern is that weekly S1 number at 1989.75.....but we can still try if volume dries up as we make new lows....just trade smaller and don't average in....don't be afraid to take small losses to get one GOOD one !!
my plan is to wait an see what kind of reaction we get once / if we hit back to the 1997 swing low then think about the long side.....no catching falling knives for me today....backup plan is if we hit that weekly S1 ...otherwise I am waiting now....we have a nice bell curve as per time
here is bell curve with 2000 - 2001 as the center...hoping that leads to the eventual retest and we can get on board...so far not seeing anything and it seems they may want that weekly S1
Click image for original size
I just put on my "multiple try" glasses at 93...I like those matching highs at 96.50 as a target and volume is drying up now....then will try for the center of that bell if I can get something going down here
final ideas for the day...including loud kids in the background...the joys of summer......
last try for me is at 82.50 ...we have two bell curves now....center is at 91 on lower bell ...magic glasses are broken today on my multiple try trades...can't get more than a 2.5 point pop and am not making money on them ( just ...getting rusty I guess...I'd like Ib low to get tested but will try for 86.50...multiple single prints on the charts...we are under daily S2 now.....no more after this try
Nice explanation on POC vs VPOC Bruce, I thought a shift lower normally implies lower prices but in this case you were right, buyers stepped in. The price action has changed since then but good assessment on your part.
Sharks
Sharks
Emini Day Trading /
Daily Notes /
Forecast /
Economic Events /
Search /
Terms and Conditions /
Disclaimer /
Books /
Online Books /
Site Map /
Contact /
Privacy Policy /
Links /
About /
Day Trading Forum /
Investment Calculators /
Pivot Point Calculator /
Market Profile Generator /
Fibonacci Calculator /
Mailing List /
Advertise Here /
Articles /
Financial Terms /
Brokers /
Software /
Holidays /
Stock Split Calendar /
Mortgage Calculator /
Donate
Copyright © 2004-2023, MyPivots. All rights reserved.
Copyright © 2004-2023, MyPivots. All rights reserved.