Click image for original size
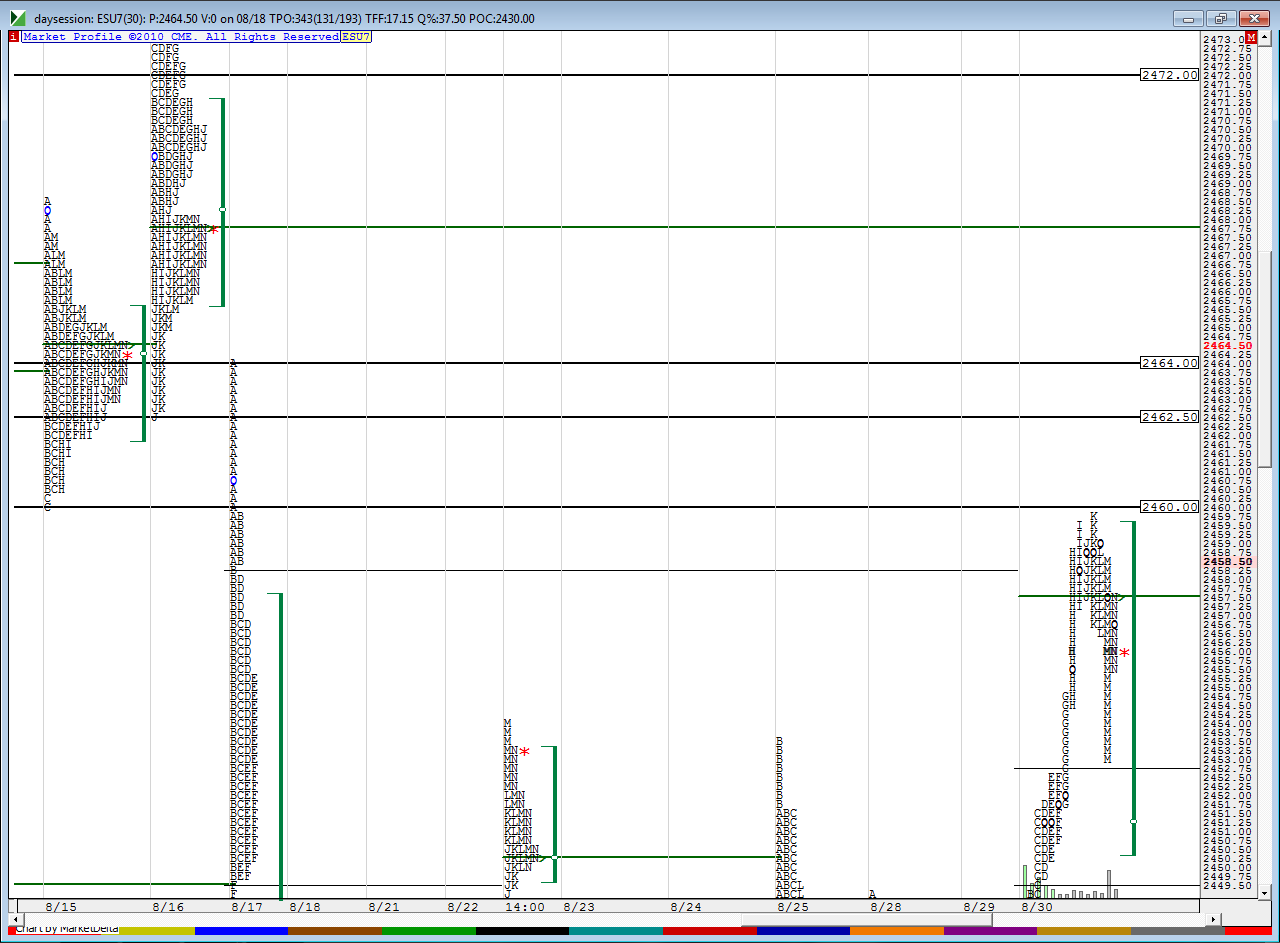
Next lets go to the daily Mp chart...Note the selling tail from 8-17 trade that broke down the lows from 8-15 and look where Wednesdays high is....also note that I have the high of that day marked and also the breakdown point from the 16th of August...so lines are snapped at 62.50 and the 64...right in between is our 63.75 !!!
Click image for original size
and last but not least is my favorite chart that breaks apart Wednesdays session with most of the high and low time areas marked
Click image for original size
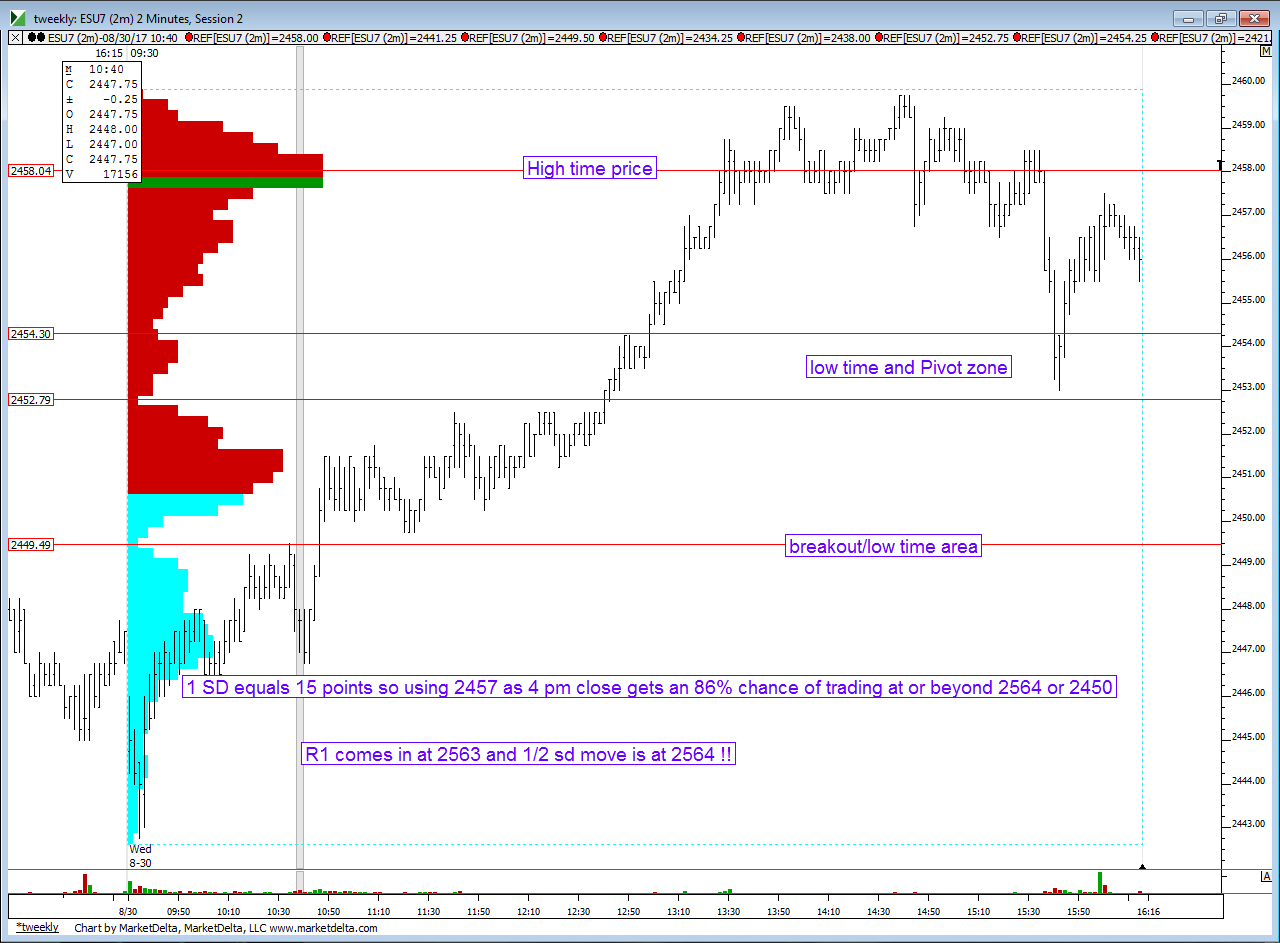
above the 62 - 64 will be the POC from 8-16 at 2567.75 and a low time spot just above at 2568.25