Merged Profile
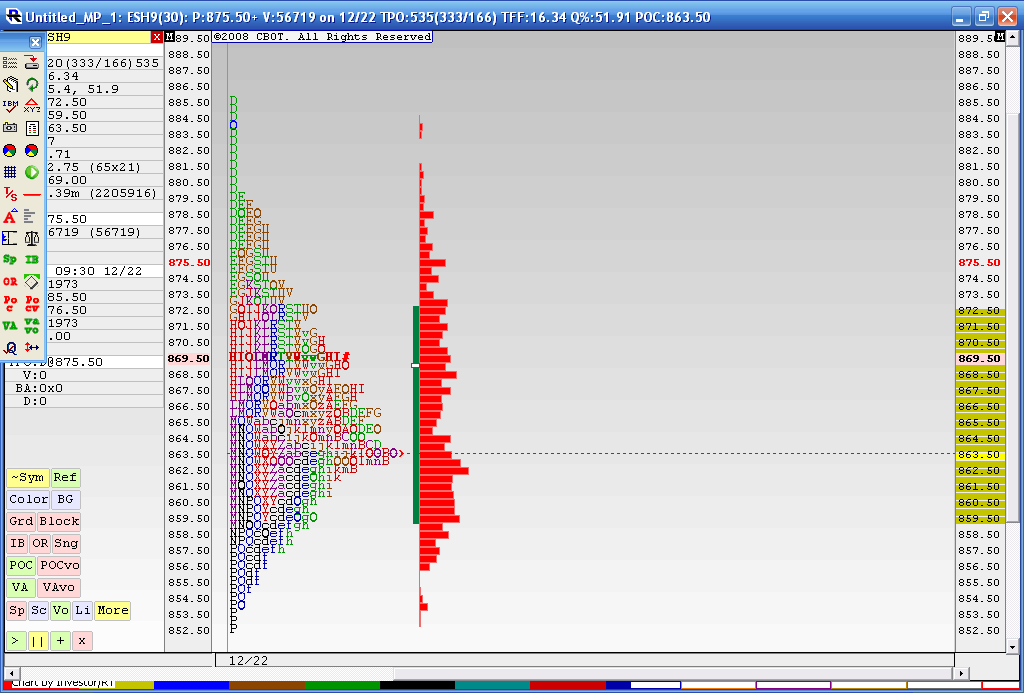
Below is the result from a 4 day merged profile as this is where we most recently have consolidated during holiday trade. The Value area high of this merge is 872.50 and the Value area low is 59.50. You may also notice that the 863.50 price has had the most trade through so far. This chart doesn't include today's trading. I think that 59.50 - 63.50 is the area we need to beat for any upside to take hold as we have the Va low and that Volume node. Current overnight high is 73.50 so it was fairly close to the merged VA high of 72.50.
In today's trading we have single prints created to the downside and through that high volume node. I'm skeptical because of the holidays and low volume but as most know we will trend many times after consolidations. I'm not sure if this counts. Anyway it's been fun firing up the old MP software for a change.
To make a long story longer: That 859.50 - 863.50 is the critical zone to watch.
Click image for original size
thanks bruce.i have trouble with all the pov etc abbrvs,nice call and example putting that together,does that indicate tommorrow filling in the top of the bell curve/
here is the update to our longer term profile
Click image for original size

you should get Daltons book.......Mind over Markets...I think they may try and bring in the breakout traders above todays highs but the main goal will be to test below 35 - 37.......we need to watch the opening closely.........and to see which way we travel first....these longer term profiles and merges are just a guide for me . I'm not counting on sustained upside follow though.
Yesterday we had some classic signs with the gap outside of range and a small first 60 minute range ( IB) My hope is for an open and a first push up to sell into to retest the open price at least..and lower..
ONE last thing...if you look at the shape of the profile from yesterdays trade it resembles the "p".......so basically after noon time we just went side ways............so that sideways conslidation is critical to watch....so I'm leaning to short side if the signals come that way
quote:
Originally posted by iowa
thanks bruce.i have trouble with all the pov etc abbrvs,nice call and example putting that together,does that indicate tommorrow filling in the top of the bell curve/
sorry for rambling so much in my other post...yes...to your question...you have a good read on the profiles
quote:
Originally posted by iowa
thanks bruce.i have trouble with all the pov etc abbrvs,nice call and example putting that together,does that indicate tommorrow filling in the top of the bell curve/
I think it's interesting that the market blew through the low volume 850 area with HIGH vertical volume.....in that 47 - 52 zone....now it will be cool if they can go fill that in with TPO prints...up at 61 now approaching high volume node of 66 from the composite
edit ..a plus 20 off the open is a quick move in the first 90 minutes..so I'm starting my fades.....1.5 the weekly IB hit above 854...problem arises with that 866 as a magnet
edit ..a plus 20 off the open is a quick move in the first 90 minutes..so I'm starting my fades.....1.5 the weekly IB hit above 854...problem arises with that 866 as a magnet
Friday's action was interesting in relation to the merged profile.
We found support early at the high volume 840 level. Then rallied to the next high volume at 866 in the afternoon which effectively stopped the upside and market went essentially sideways to the close.
I would also note, the zone of maximum upside price velocity Friday (and single prints) is centered right in the low volume zone (850).
Here is how fridays trade looks against a close-up of the longer term profile. I think Pt-emini summed it up.....
Click image for original size

I've noticed something different in my trading since I started looking at longer term profiles.....I'm actually more patient. Even on the opening "window" plays. Normally on a day like Friday I would have been agressively shorting as we broke the 5 day composites range. While my first shorts didn't amount to much from the 61 area I was happy to read some of the clues. I'll mention them here but I didn't notice all of them at the time. I've also made reference to MInd over Markets and the page numbers where some explainations can be found.
1) We had an open , test and drive which blew out of the key 40 -44 zone on super high vertical volume.....page 63 and page 80..outside of value but in range
2)Biggest 30 minute range in two weeks or more breaking out of a balance area ...page 288
3) low volume being erased real quick ..page 167
4) High volume up at the 866 and how these high volume zones attract price and are not a PERFECT line in the sand...page 162
We had some amazing vertical high volume ( not time tpo's) in the 847 - 852 area so that is the retest zone and key support
We have had two "P" profiles so I won't be surprised to see the selling step in ( this is another lesson - I was wrong on Fridays bias but still did ok....did anyone actually get on board that break out?.....I'm trying to be more flexible)
Here is the chart and how we broke out of that 5 day balance area...
one last thing ...we'd be foolish to ignore Kools closing Tick concept and a closing Trin of 39.........
1) We had an open , test and drive which blew out of the key 40 -44 zone on super high vertical volume.....page 63 and page 80..outside of value but in range
2)Biggest 30 minute range in two weeks or more breaking out of a balance area ...page 288
3) low volume being erased real quick ..page 167
4) High volume up at the 866 and how these high volume zones attract price and are not a PERFECT line in the sand...page 162
We had some amazing vertical high volume ( not time tpo's) in the 847 - 852 area so that is the retest zone and key support
We have had two "P" profiles so I won't be surprised to see the selling step in ( this is another lesson - I was wrong on Fridays bias but still did ok....did anyone actually get on board that break out?.....I'm trying to be more flexible)
Here is the chart and how we broke out of that 5 day balance area...
Click image for original size

one last thing ...we'd be foolish to ignore Kools closing Tick concept and a closing Trin of 39.........
i'm looking at that 880-83 and 850-53 as a range for tommorrow,maybe 2 days with the bailout delay,1 day at a time for now
A Value Area (VA) overlay chart suggests that 872.00 - 874.00 is likely to offer significant resistance and would likely be a low risk entry to go short. Prices should at least test the 840.00 area with the possibilty of further down side rotation.
What is Kool's closing Tick concept?
What is Kool's closing Tick concept?
Click image for original size

We had a break out up on yesterdays high Volume fed announcement.....now we need to see if we can attract Volume above...my feeling is that they will fail on this breakout and we will get daily closes back below 867.....Sure hope I'm wrong for the longer term players like myself....I'll get a chart later
Emini Day Trading /
Daily Notes /
Forecast /
Economic Events /
Search /
Terms and Conditions /
Disclaimer /
Books /
Online Books /
Site Map /
Contact /
Privacy Policy /
Links /
About /
Day Trading Forum /
Investment Calculators /
Pivot Point Calculator /
Market Profile Generator /
Fibonacci Calculator /
Mailing List /
Advertise Here /
Articles /
Financial Terms /
Brokers /
Software /
Holidays /
Stock Split Calendar /
Mortgage Calculator /
Donate
Copyright © 2004-2023, MyPivots. All rights reserved.
Copyright © 2004-2023, MyPivots. All rights reserved.