ES TUES 7-12-11
The overnight Low was 1295.25
50% of last month's RTH range = 1294.00
50% of last month's 24hr range = 1297.25
IMHO, Low for the 24hour is probably already in
This is OpEx week. specialists have already sucked the premium out of the calls. Maybe it's time for them to sell the premium inflated Puts before they come in with fists-o-cash to push prices higher for a premium wipeout of the puts.
50% of the current week is 1317.25, Pivot (RTH) for today is 1319, this zone should be tagged.
Nice levels and I also think weak sub 1320
also wanted to add the other retrace levels
38.2-1318
23.6-1309.25
1318.50 is also par for those on the wrong side at eod Monday
thanked their deity and exited, see if selling ends?
1317.25
also wanted to add the other retrace levels
38.2-1318
23.6-1309.25
1318.50 is also par for those on the wrong side at eod Monday
thanked their deity and exited, see if selling ends?
1317.25
Originally posted by Lisa P
ES tested and held O/N value area high. I went long, first target INDU 12500 (pivot point), second O/N high
khamore1, it is hard to trade and post. INDU does not have overnight values, as it is a cash index.
What I meant was, I went long on successful test of the ES O/N VAH, took my first half off when INDU reached 12,500 (as I expected sellers at that level, POC of the pennant) and took second part off near ES O/N high, which was extended to ES "gap close".
Sorry, I am not as good as BruceM at trading and posting. He is GREAT at that.
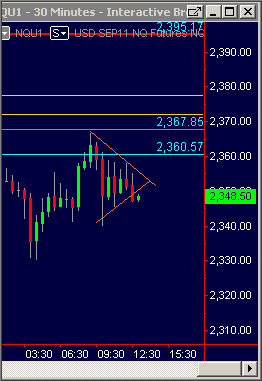
NQ 30-min chart. NQ never got out of its congestion and is drooping now. If we have a similar fakeout as INDU had before, it may take ES above 1320. I will wait for bears to make a mistake.
I have to leave soon. be back later.
I have to leave soon. be back later.
Click image for original size
DT NEVER MIND ABOUT THIS QESTION
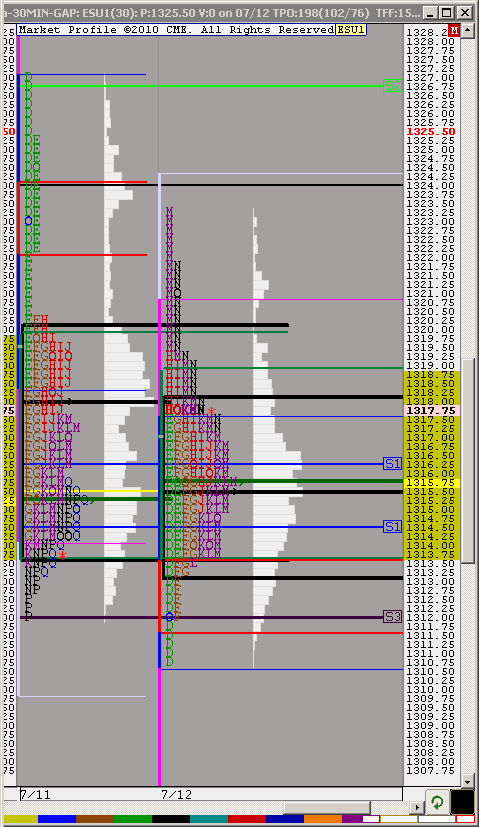
DT will you please explain the meaning of the intials on the market profile you just posted for example what is DF. DEFG. EF.......
YOUR POSTING CAME IN A DIFFERENT FORM I THOUGHT FOR A MOMENT THE LETTERS HAD A DIFFERENT MEANING SORRY I AM STILL NEWLY LEARNING MARKET PROFILE
DT will you please explain the meaning of the intials on the market profile you just posted for example what is DF. DEFG. EF.......
YOUR POSTING CAME IN A DIFFERENT FORM I THOUGHT FOR A MOMENT THE LETTERS HAD A DIFFERENT MEANING SORRY I AM STILL NEWLY LEARNING MARKET PROFILE
hope you took advantage of the 23 area i highlighted earlier today...to the tick !
taking profits here at 20.5...would have kept it longer if there was a single print to target much below the one that is currently forming it will be 19.75 if the current 30m bar closes above that level)
will re sell at 25 if they push it higher once again
taking profits here at 20.5...would have kept it longer if there was a single print to target much below the one that is currently forming it will be 19.75 if the current 30m bar closes above that level)
will re sell at 25 if they push it higher once again
Originally posted by apk781
i like selling the 23 area if they can get it up there; a bunch of things going on there including 30m 1.618 projection (o/n lows to 12.5 move), daily pivot, and the 1.618 stretch number (for those who look at them); single prints from yesterday slightly below at 22 even....will add up in the 25-25.5 area if needed (and if it is not too late)..hopefully there will be some single prints lying below to play with/target
they filled that print pretty quickly and now filling the air on 5min at 18.5...
in any case, i doubt there will be time for some action on my side, so good luck all
in any case, i doubt there will be time for some action on my side, so good luck all
Apk 781..I was with ya and it took me two tries...The weekly open ! Folks gotta know that !! More important for me is I am making some great progress with my Footprint/ market delta understanding. I will never again be caught in a bad fade that I keep adding to and here is why:
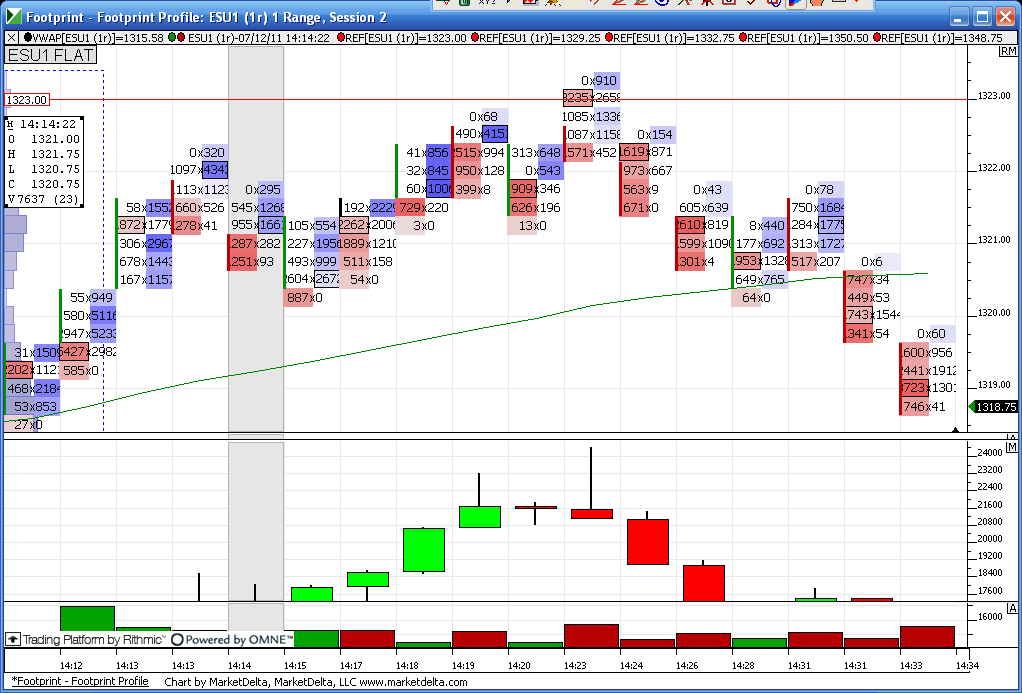
This is a one minute range chart ( thank you PT ). With cumulative delta in the center and volume in the lower pane...I went short at the close of the 14:19 bar and exited on the close of the next bar for a small loser. WE had good volume but delta closed up on the 14:19 bar ( see center pane). I reshorted at the 14:23 bar...a perfect test of the 1323 weekly open and then look at the delta....a great close down ( not up)and higher volume then the previous bar once again....look at the huge wick for you candle folks on the delta !!
Naturally this has got to be put in context at key areas....I'm too dumb to take trades all over the place with Footprints..but we had air pockets below as u have said....so this is my focus now...busting my ass to figure this out....I think most have the levels figured out....for me it's figuring out what happens at the levels...
This SH-T is FINALLY starting to make sense..so now my obsessive nature will take over. I'm dropping out for a while to concentrate on this effort. Here is the chart..!
Click image for original size
very interesting bruce, thanks for sharing that
i usually don't look at the weekly open, but it obviously has its effect, so will add it to my list of things to watch (very long as it is !)
i now feel i could have stayed a bit longer on the trade...i usually have runners but did not use any this time for the reason stated in my previous post...against my case, a/d was not in trend mode by any means so should have expected them to bring it back inside the va/5min air fill...oh well, profits are profits so i am not complaining, just giving lecturing myself out loud
Originally posted by khamore1
DT will you please explain the meaning of the intials on the market profile you just posted for example what is DF. DEFG. EF.......
They are TPO's - follow that link for the dictionary definition.
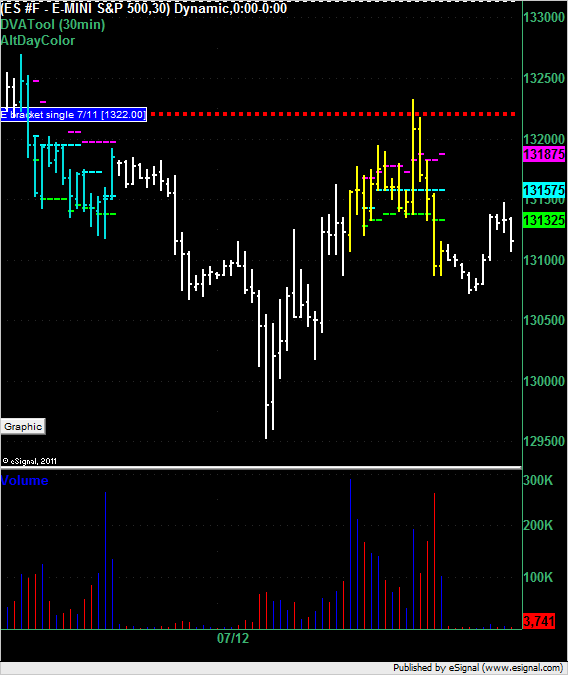
Just a single print recap from today. The single print left on the chart at 1322 even yesterday would have suffered a 1.25 point draw down if used as a short entry location.
Click image for original size
Emini Day Trading /
Daily Notes /
Forecast /
Economic Events /
Search /
Terms and Conditions /
Disclaimer /
Books /
Online Books /
Site Map /
Contact /
Privacy Policy /
Links /
About /
Day Trading Forum /
Investment Calculators /
Pivot Point Calculator /
Market Profile Generator /
Fibonacci Calculator /
Mailing List /
Advertise Here /
Articles /
Financial Terms /
Brokers /
Software /
Holidays /
Stock Split Calendar /
Mortgage Calculator /
Donate
Copyright © 2004-2023, MyPivots. All rights reserved.
Copyright © 2004-2023, MyPivots. All rights reserved.