ES Thursday 10-13-11
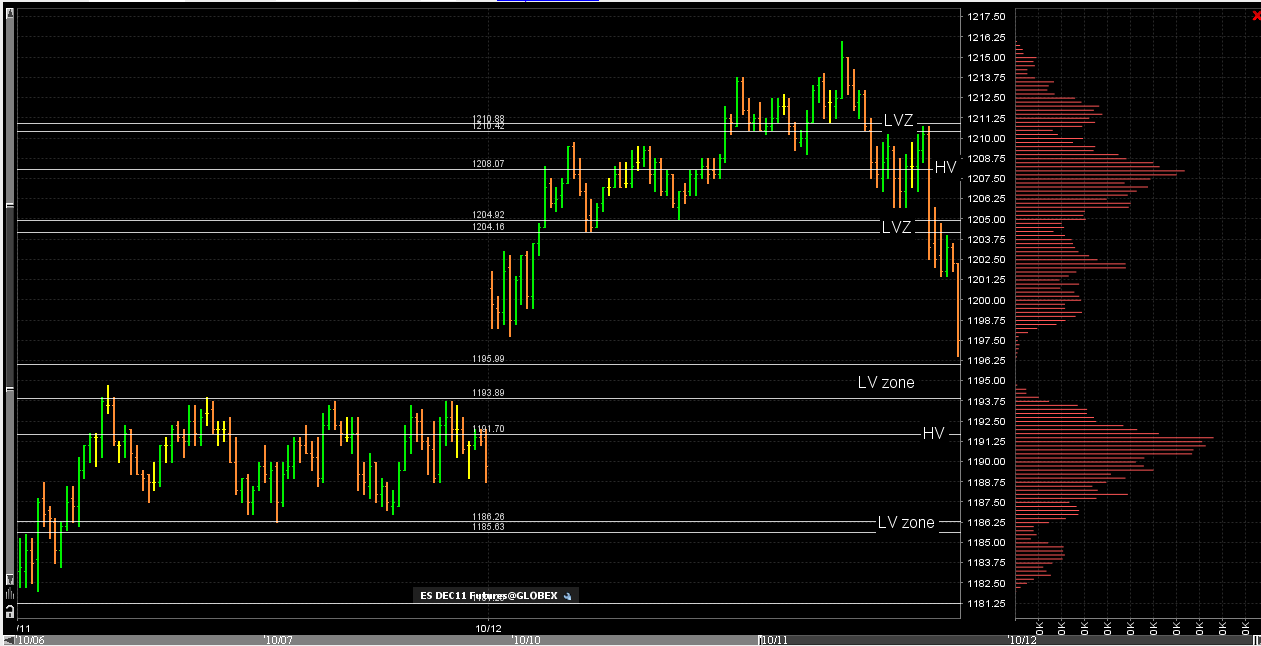
I know many are getting new charts and becoming familiar with volume profiles. Here is the last two days for reference with the appropriate high and low volume marked off. This way those who are new can compare their charts to this one. Lots of good bell curves to work with once the 8:30 reports come out
Click image for original size
Sorry Bruce, got on the phone. Did not mean to hold you.
I wanted to ask you about "yesterday's numbers" Do you use them all current day, or you stop using htem when they are tested or traded through?
I wanted to ask you about "yesterday's numbers" Do you use them all current day, or you stop using htem when they are tested or traded through?
thanks for correcting me.....perfect..u see it..great stuff
Originally posted by della
yes i do when you talk about yesrerday you mean 10/11
this is great stuff
I will generally take them the first time tested ..especially in the morning session.I am constantly asking myself " Are they accepting or rejecting trade inside particular bell curves and the volume that forms. They get tested quite often to see if there is continued interest.
Often you will see the bell curves once broken become Support...using today as an example and the 10-11 bell curve..."Can they get back and take over that volume?"
Now here comes the most important part of the answer...I use them until the day ends but I am a light weight the longer the day goes on....too much conflicting information from the developing day sometimes...like my comments about the 89 and 91 today that never did the retest.....so I will not use the 10-11 bell curve any more except for the 1185 - 1186 area but only because it held as support today and no other reason...
Now that the day is over I use todays bell curves and low volume for tomorrows trading as it is the most recent completed day....the 10-11 areas of 1193 - 1194 and the 1191 are dead to me and not longer used. BUT.......and this is a big but...now we have low volume at 94.75 and 92.75 generated from todays trade....we also have 91 and 89 from todays high volume nodes.....I only use those for targets as u know and don't initiate off those as they are in the center of that range.
I spent a long time on a tangent...spent probably a good two years using ranges as i got a bit sidetracked with some of Dr. Bretts work that isn't really as relevant as I thought .Now I am back to my roots and believe it is the VOLUME and not usually the extremes of ranges that is most important...
let me know if that is clear....
Originally posted by Lisa P
Sorry Bruce, got on the phone. Did not mean to hold you.
I wanted to ask you about "yesterday's numbers" Do you use them all current day, or you stop using htem when they are tested or traded through?
Lisa the 97.75 is part of low volume too..but the most important part to me is the 92.75 - 94.75 because that is the closest low volume area that "protects" the high volume of the bell curve below that zone
This is why trading at the edges is the best reward...if we are buying into that zone then we alwasy assume that high volume may slow price down as we get closer to it..
This is why trading at the edges is the best reward...if we are buying into that zone then we alwasy assume that high volume may slow price down as we get closer to it..
Thanks Bruce. i will "digest" this tonight.
got it...thanks
one thing that was cool was the open today went to the 96.00 first the LV area on top and not to Lv on bootm wich was 86.00 i think because its the closes maybe im rite for a change
u r right a lot ...just not this time.....LOL..I have an opening range high of 1195....hence one of the reasons I thought the 96 would be revisited....a great example of KNOWING what should happen but not being able to hold contracts to reach that target.
Originally posted by della
one thing that was cool was the open today went to the 96.00 first the LV area on top and not to Lv on bootm wich was 86.00 i think because its the closes maybe im rite for a change
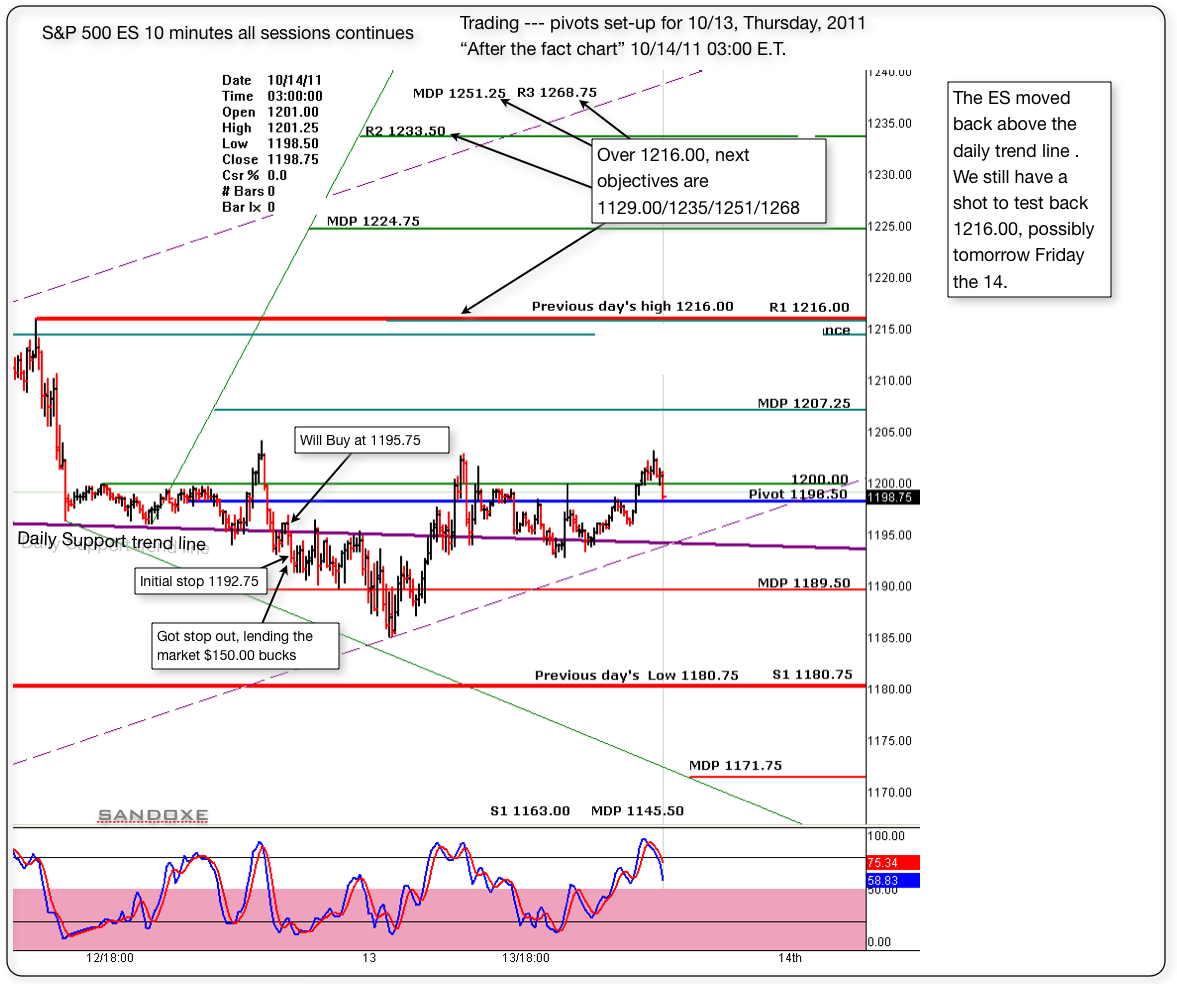
Below is the 10 minutes follow up chart or "after the fact chart" Today was not my day. After the first trade I knew it was best to stay away. Did one more trade and luckily got stop out at B.E. But, I still lend the market $150.00 for the day.
In trading, you will find, that, no matter what system you have, or how good of a trader you are, there will be days when you are not in the "zone" Those are days that it's better to close shop and go play.......
In trading, you will find, that, no matter what system you have, or how good of a trader you are, there will be days when you are not in the "zone" Those are days that it's better to close shop and go play.......
Click image for original size
Originally posted by sandoxe
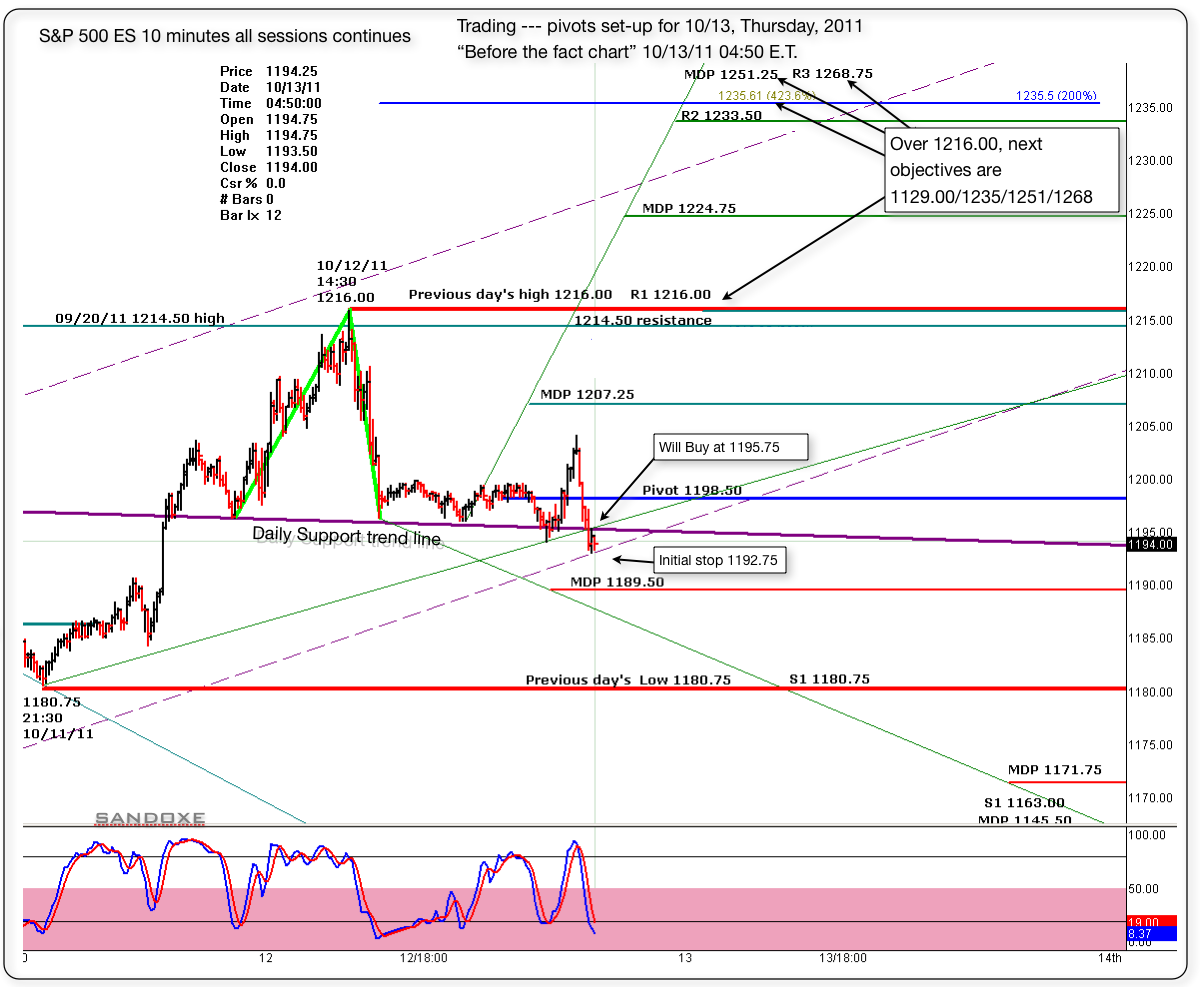
If the bulls still want to give it one more test to 1216, and possibly 1229 with good spike after that I'm Ok with it. Maybe today and tomorrow.
Below is the "before the fact chart" with the pivots set up for today. I'm buying at 1195.75, just above the daily trend line.
Initial stop at 1192.75.
Will see what the market has for us, and as always, the market has the last word and in due time will show us the way.
I see for you the same I see for my self: Having the best of luck and fun, awesome profitable trading day!
Click image for original size
Emini Day Trading /
Daily Notes /
Forecast /
Economic Events /
Search /
Terms and Conditions /
Disclaimer /
Books /
Online Books /
Site Map /
Contact /
Privacy Policy /
Links /
About /
Day Trading Forum /
Investment Calculators /
Pivot Point Calculator /
Market Profile Generator /
Fibonacci Calculator /
Mailing List /
Advertise Here /
Articles /
Financial Terms /
Brokers /
Software /
Holidays /
Stock Split Calendar /
Mortgage Calculator /
Donate
Copyright © 2004-2023, MyPivots. All rights reserved.
Copyright © 2004-2023, MyPivots. All rights reserved.