ES Thursday 10-13-11
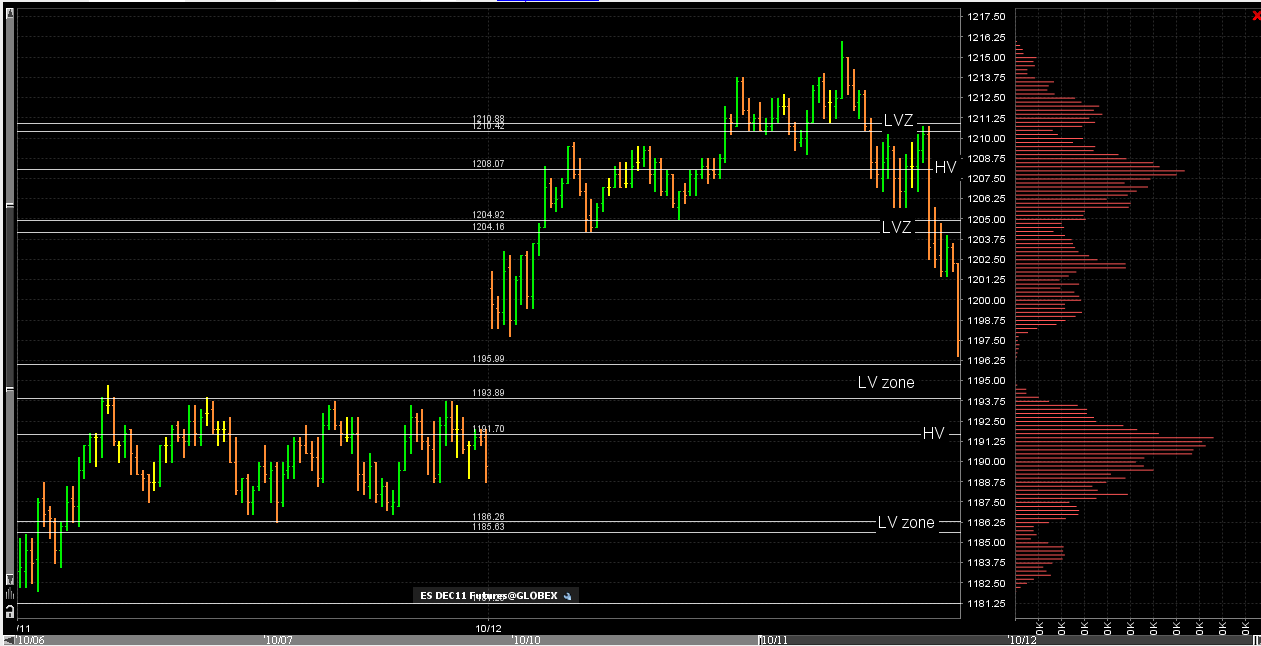
I know many are getting new charts and becoming familiar with volume profiles. Here is the last two days for reference with the appropriate high and low volume marked off. This way those who are new can compare their charts to this one. Lots of good bell curves to work with once the 8:30 reports come out
Click image for original size
Originally posted by BruceM
that was a nice visual Lisa posted and a very viable option to find the key volume areas...whatever works...
Thanks BRuce. It worked because there was hardly any overlap.
If we can stay above the IB now {87} a case can be made that we can break 2 pts above to 97 some time today.
I wish it will go up with momentum and trending or down with momentum and trending LOL.-.-. 20 more minutes. If not, I'm going out for some delicious lunch hmmmm...
that would be cool RBurns...I'd like to see them back and fill this 91 number to bring the peak volume back up...so far they are working hard to round out the bell curve today..so if they can do that I think we will get the pop higher..
spending more time at 88.75 will not be a good thing as it will increase the volume down below...hopefully we won't see that
spending more time at 88.75 will not be a good thing as it will increase the volume down below...hopefully we won't see that
fascinating to watch as they work on that 91 area...getting real close to a shift up in the Volume peak price
Highest volume Print today at 11:47. IF we move above it, that party will cover providing "rocket fuel"
Click image for original size

interesting that price is pulled up but peak volume hasn't shifted yet up to 91....so this rally above those 93.75 stops is suspicious and it seems a bit too early in the day..I iwll not be surprised to see them come back for 91 again
Bears are trying
Click image for original size

Originally posted by BruceM
interesting that price is pulled up but peak volume hasn't shifted yet up to 91....so this rally above those 93.75 stops is suspicious and it seems a bit too early in the day..I iwll not be surprised to see them come back for 91 again
Bruce, is this still 91 level from yesterday? or you have something else today at that price?
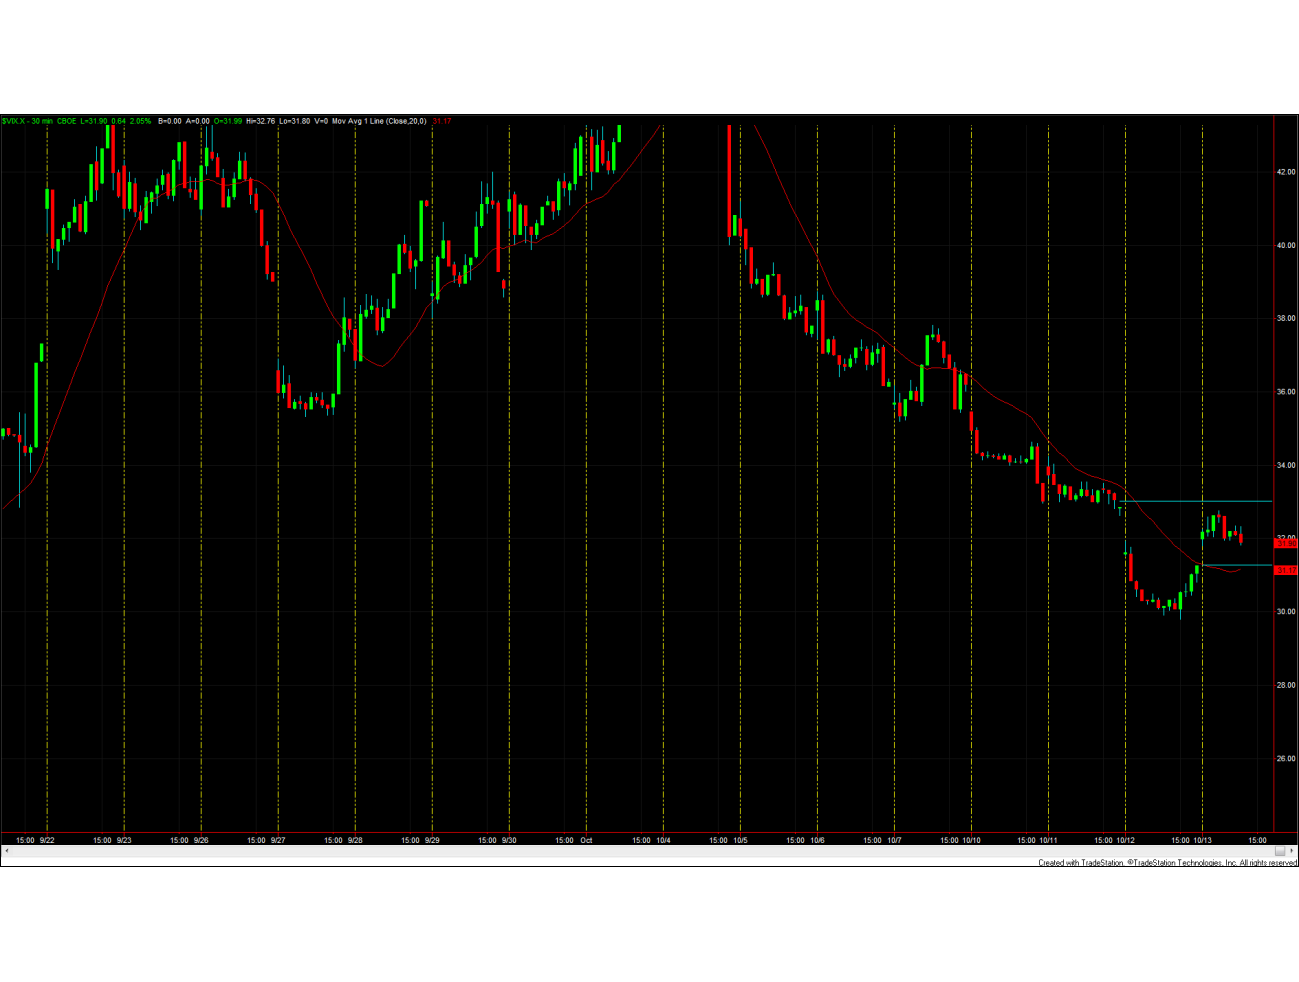
VIX 30 min suggests that move up will continue (at least to gap closed)
Click image for original size
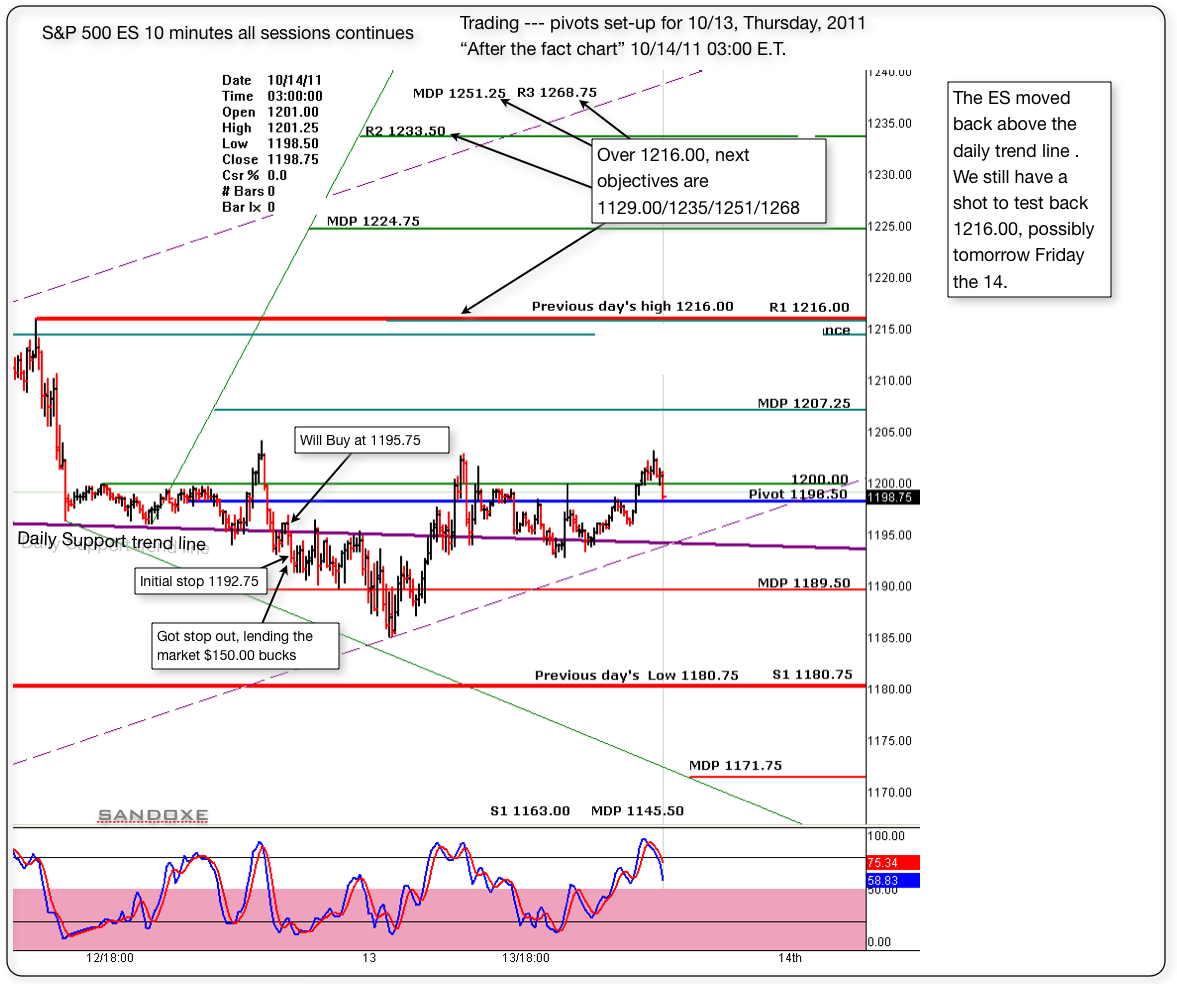
Below is the 10 minutes follow up chart or "after the fact chart" Today was not my day. After the first trade I knew it was best to stay away. Did one more trade and luckily got stop out at B.E. But, I still lend the market $150.00 for the day.
In trading, you will find, that, no matter what system you have, or how good of a trader you are, there will be days when you are not in the "zone" Those are days that it's better to close shop and go play.......
In trading, you will find, that, no matter what system you have, or how good of a trader you are, there will be days when you are not in the "zone" Those are days that it's better to close shop and go play.......
Click image for original size
Originally posted by sandoxe
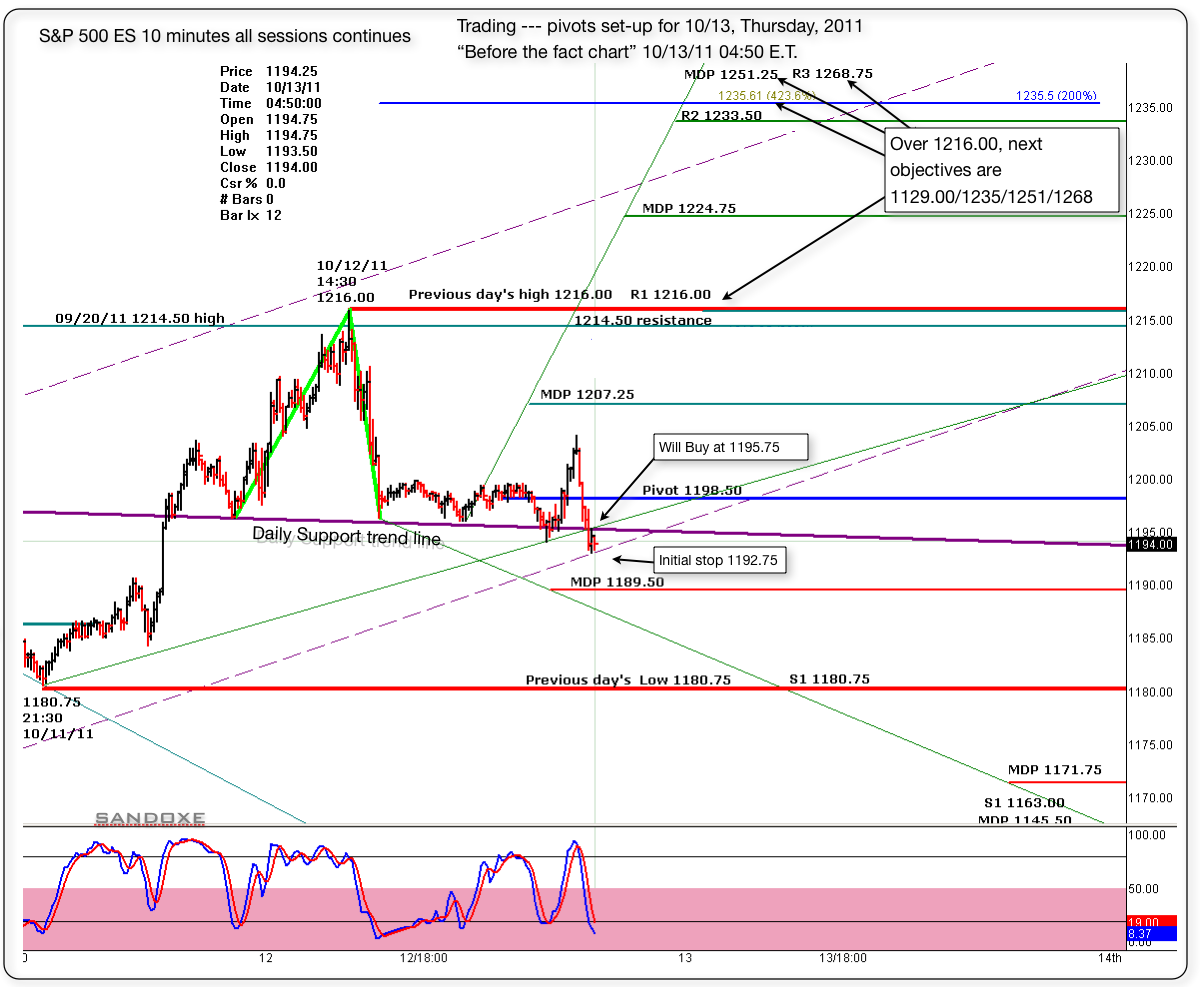
If the bulls still want to give it one more test to 1216, and possibly 1229 with good spike after that I'm Ok with it. Maybe today and tomorrow.
Below is the "before the fact chart" with the pivots set up for today. I'm buying at 1195.75, just above the daily trend line.
Initial stop at 1192.75.
Will see what the market has for us, and as always, the market has the last word and in due time will show us the way.
I see for you the same I see for my self: Having the best of luck and fun, awesome profitable trading day!
Click image for original size
Emini Day Trading /
Daily Notes /
Forecast /
Economic Events /
Search /
Terms and Conditions /
Disclaimer /
Books /
Online Books /
Site Map /
Contact /
Privacy Policy /
Links /
About /
Day Trading Forum /
Investment Calculators /
Pivot Point Calculator /
Market Profile Generator /
Fibonacci Calculator /
Mailing List /
Advertise Here /
Articles /
Financial Terms /
Brokers /
Software /
Holidays /
Stock Split Calendar /
Mortgage Calculator /
Donate
Copyright © 2004-2023, MyPivots. All rights reserved.
Copyright © 2004-2023, MyPivots. All rights reserved.