27 May 2005 (Friday)
Session Start: Fri May 27 08:56:11 2005
Session Ident: #t1
[09:16:59] <guy> gm all
[09:31:53] <guy> market open
[09:32:01] <guy> nothing to trade yet...
[09:32:03] <guy2>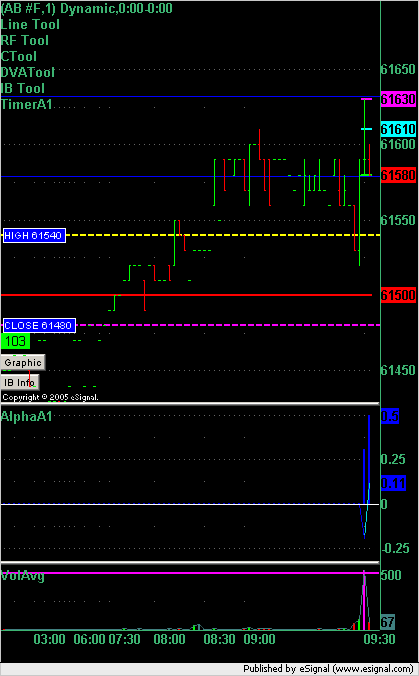
[09:33:06] <guy> economic report (consumer sentiment) in 12 minutes
[09:33:53] <mashhad> r u trading b4 the report guy?
[09:34:06] <guy> limit to enter long AB @ 614.8
[09:34:39] <guy> if i can get long here in the next 6 minutes then yes
[09:34:49] <mashhad> k
[09:35:51] <guy> this is what I see
[09:35:57] <guy> an alpha buy signal at VAH
[09:36:00] <guy2>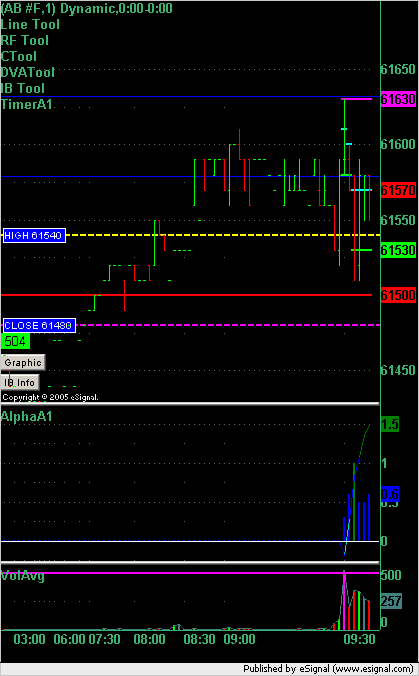
[09:36:06] <guy> with high k-line value
[09:39:40] <guy> ES k-line very strong
[09:39:45] <guy2>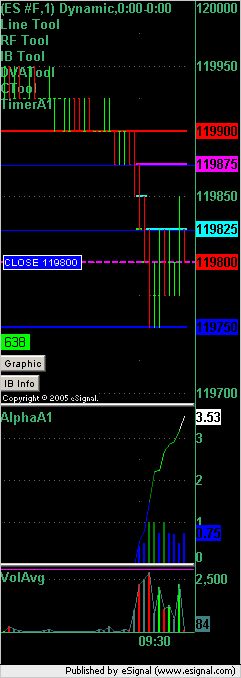
[09:40:51] <guy> ER2 ->
[09:40:59] <guy2>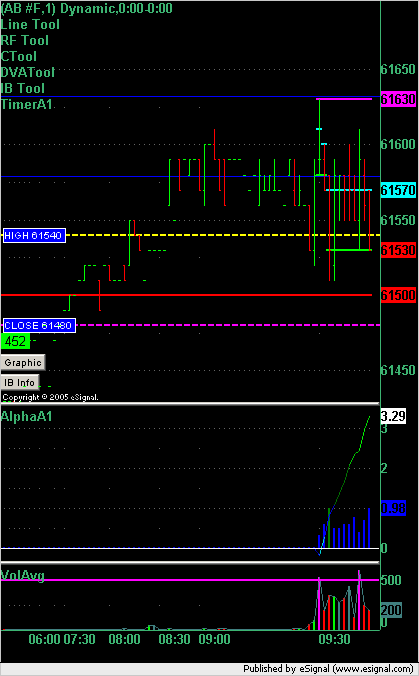
[09:41:36] <guy> cancelled all open limit orders
[09:43:25] <mashhad> guy, when k-line turns white but no signal on the alpha,is that still a goodsignal?
[09:43:45] <guy> yes if at beginning of day or at extremes (hod/lod)
[09:45:38] <guy> Buys AB @ 614.8
[09:46:18] <guy> exit stop set AB @ 612.8
[09:48:19] <guy> This trade based on VAH and alpha:
[09:48:25] <guy2>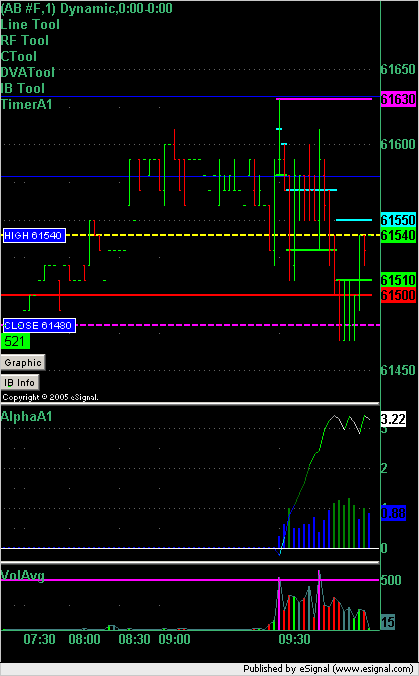
[09:48:42] <guy> (and k-line which I consider part of the alpha strategy)
[09:50:42] <guy> this is what my ES looks like
[09:50:48] <guy> it's an MP short at VAH
[09:50:50] <guy2>
[09:51:02] <guy> but alpha/k-line filters the short out
[09:51:58] <mashhad> looks like market is now reacting tho the report
[09:53:15] <mashhad> we have gone through the open 3 times already...
[09:53:34] <guy> yes
[09:58:48] <guy> This chart has the TimerA1
[09:58:54] <guy2>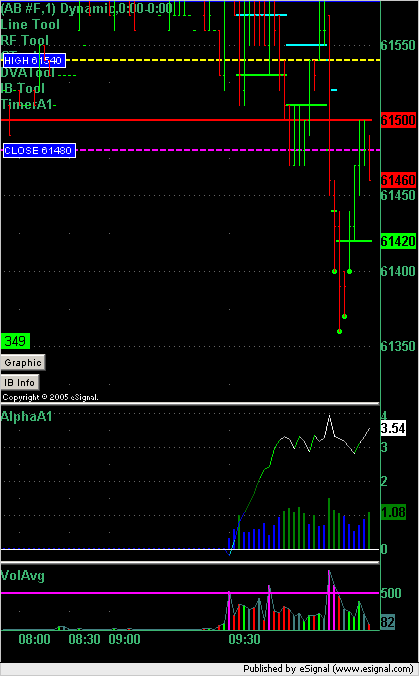
[09:59:07] <guy> showing extreme readings for $tick on the chart
[09:59:47] <guy> i'm going to MacG from 614.8 if we get there now...
[09:59:57] <guy> I mean 613.8
[10:00:38] <guy> exit stop lowered AB @ 611.8
[10:00:48] <guy> limit to enter long AB @ 613.8
[10:01:25] <mashhad> are u looking to MacG?
[10:01:32] <guy> yes
[10:01:43] <mashhad> good luck
[10:02:20] <fspeculator> so basicvally guy
[10:02:30] <fspeculator> the MP part is irrelevant in your trading
[10:02:46] <fspeculator> as maybe half of the time it conflicts with your other indicators
[10:02:48] <fspeculator> right?
[10:04:52] <guy> well there are 3 elements: (1) timing (2) direction (+strength of direction) (3) placement
[10:05:21] <guy> if all 3 are present then it's a great setup
[10:05:39] <guy> if 2 are present then it's probably (although not neccessarily) a good setup
[10:07:03] <fspeculator> can you say that any days during last 10 days had any direction?
[10:07:15] <fspeculator> we had a 10pt ES weekly range
[10:11:03] <guy> well they probably had intraday direction for hours at a time right? Mon & Tue afternoons for example and Wednesday morning...
[10:12:48] <mashhad> were u able to Macg?
[10:12:59] <guy> n
[10:16:31] <fspeculator> http://charts.dacharts.com/2005-05-27/es.png
[10:16:39] <fspeculator> mon & tue seem trendless for me on ES
[10:16:42] <fspeculator> maybe ER was better
[10:17:48] <guy> Buys AB @ 613.8 -> Add
[10:19:48] <tuna> i show a single at 11.9
[10:23:12] <guy> single at 11.9 ?
[10:23:58] <tuna> yup
[10:24:07] <tuna> from yest
[10:24:15] <tuna> shows here
[10:24:28] <guy> what letter?
[10:24:32] <tuna> kinda odd
[10:24:36] <tuna> e
[10:25:04] <guy> no G print?
[10:25:26] <tuna> not today
[10:25:39] <tuna> weird
[10:26:18] <mashhad> i don't show a single there
[10:26:30] <guy> I don't either
[10:26:40] <mashhad> i show it was filled by G period
[10:26:44] <guy> I have a MacG limit sell at 614.8
[10:26:52] <guy> i have same as mash
[10:27:00] <tuna> esig 7.8 here
[10:27:02] <guy> confirm on your bar chart tuna
[10:27:16] <guy> tuna: look at G period on a bar chart and see what the low was
[10:28:00] <tuna> yes it is weird
[10:28:30] <tuna> but today it shows a single fwiw
[10:29:23] <guy> MP graphic is often wrong
[10:29:34] <guy> need to confirm by looking at a bar chart for that period
[10:29:40] <guy> to see if MP missed something
[10:29:49] <tuna> heres the thing,,,if i see it prolly alot of other guys do too even if its not correct
[10:30:06] <guy> also try and switch the MP chart between tick factor and tick value
[10:30:11] <guy> and see if it changes
[10:30:39] <guy> unsurprisingly RF split counts all -2
[10:30:45] <guy2>
[10:32:16] <tuna> yes guy mp is not correct,,but thats what it is displaying atm
[10:32:23] <guy> ER2 IB info:
[10:32:30] <guy2>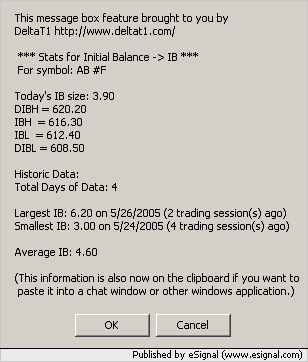
[10:32:34] <guy> okay tuna - thanks
[10:32:37] <mashhad> today is considered an open auction in range, and according to dalton's book only established extremes should be trades (not VAs)
[10:32:52] <mashhad> for what it's worth
[10:33:19] <guy> explain mash... don't remember that part
[10:33:46] <mashhad> pg 70-71
[10:37:32] <mashhad> the way i took it was since open auction in range usually turns out to be a small range day, trading Vas will not give enough room,.. for example right now the distance between DVAH and DVAL in ES is only 1.5 ...foy myself who likes to set my inital target at +2, this is nt enough so i either have to trade the extreme H or L of the day or reduce my profit target which i won't.
[10:39:25] <mashhad> this is looking at ES off course...
[10:40:35] <guy> i had to find the Dalton book - would you believe that someone was using it to prop up a light stand? the cheek of it!
[10:40:41] <guy> yup i agree mash
[10:40:48] <mashhad> :)
[10:41:06] <guy> Here is the ER2 chart
[10:41:14] <guy> k-line and alpha are keeping me long here
[10:41:18] <guy2>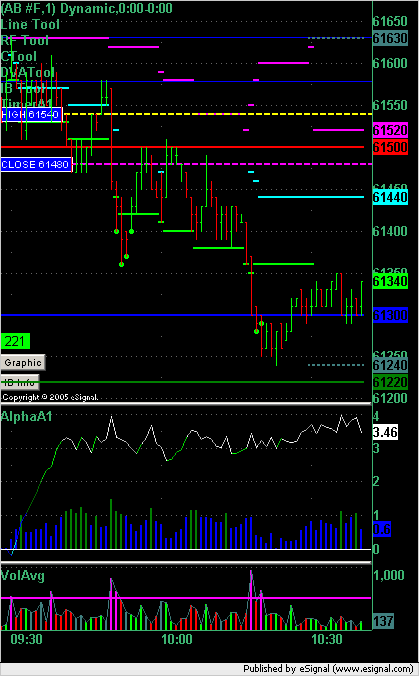
[10:41:58] <fspeculator> ,,,,guy i exited b/e
[10:42:13] <fspeculator> and will try to relong 612.1 if i get chance
[10:42:17] <guy> were did you go long fspec? i didn't see your entry?
[10:42:27] <fspeculator> 613.2
[10:42:29] <guy> why 612.1 ?
[10:42:52] <fspeculator> one-tick of IB and look for biz below yesterday's PM range
[10:43:18] <fspeculator> maybe i miss it
[10:43:28] <fspeculator> but often it makes new lows before
[10:43:47] <fspeculator> ES is untradeable anyway, ER is so much better
[10:43:57] <fspeculator> this time i'll waste no time hope and wait
[10:44:12] <fspeculator> go where the action is (EUR and ER right now)
[10:52:36] <guy> ER2 still showing great potential here:
[10:52:39] <guy2>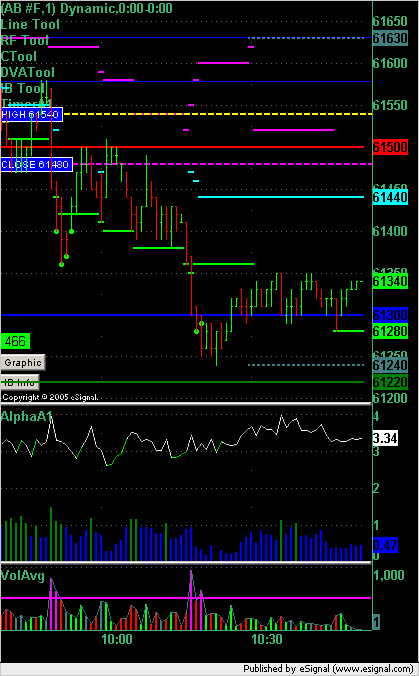
[10:52:41] <guy> (on the upside)
[10:55:31] <fspeculator> when alpha >0 => long?
[10:58:55] <guy> correct
[10:59:03] <guy> so alpha has been long all day
[11:00:26] <guy> split counts / rotation factors coming up...
[11:00:27] <guy2>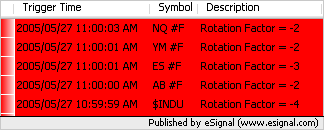
[11:21:56] <guy> alpha wants long again hre:
[11:21:58] <guy> here:
[11:22:03] <guy2>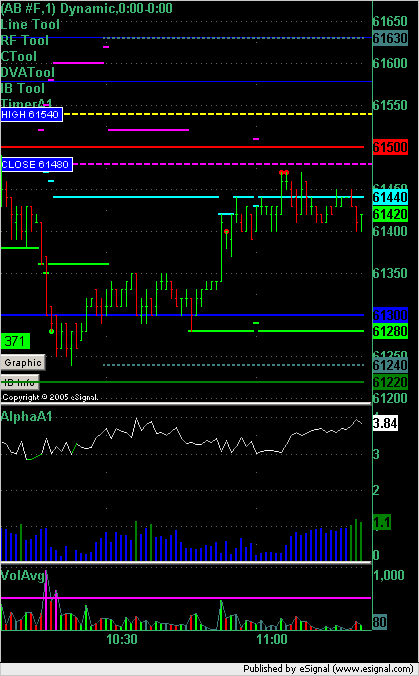
[11:27:01] <guy> here comes a chart that I like to look at
[11:27:05] <guy2>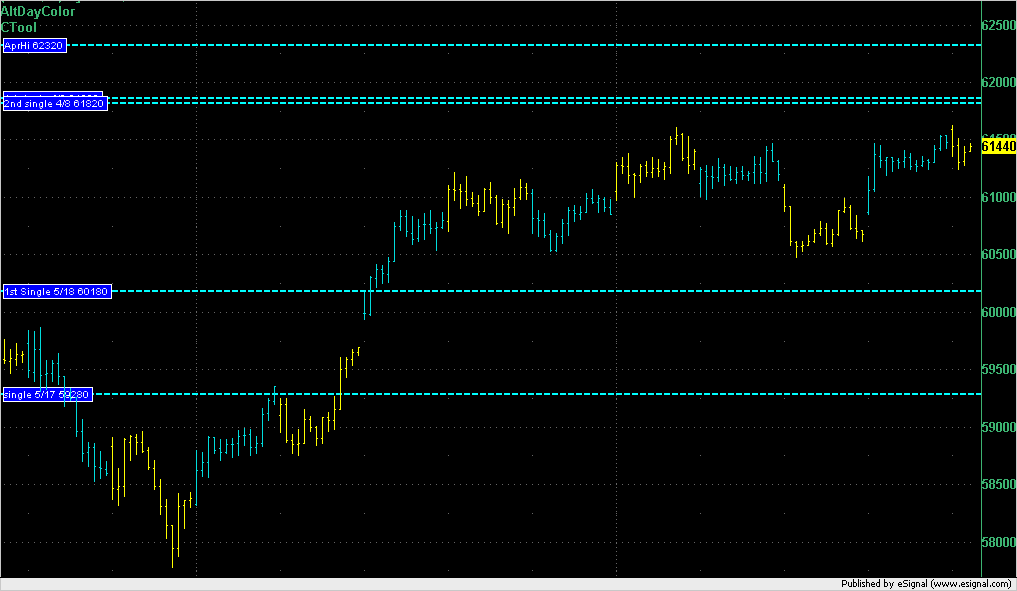
[11:27:10] <guy> it's the 30min bar for the ER2 during RTH
[11:27:18] <guy> It has 2 indicators on it
[11:27:31] <guy> CTool shows all the singles around the price
[11:27:50] <guy> and the AltDayColor changes the color for each day to give perspective
[11:28:52] <guy> this chart gives me a feeling for who hurting and who is happy
[11:29:07] <guy> at the moment it tells me that the longs are happy and the shorts are hurting
[11:29:29] <guy> we're going into a long weekend and we are at 40 day highs which we can see from the Daily Notes page
[11:29:53] <guy> for all equity markets
[11:30:28] <guy> so we know that all the shorts that are still holding over the last 40 trading sessions are hurting
[11:30:58] <guy2>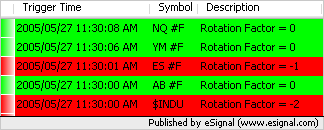
[11:33:38] <guy> split counts are improving for this long i'm holding
[11:34:16] <tuna> hugging the vwap here
[11:36:35] <guy> tuna: can you post a chart showing us the VWAP?
[11:36:56] <tuna> dunno how
[11:37:05] <guy> can you save a chart to your hard disk?
[11:37:11] <tuna> <=== is a dummy
[11:37:25] * guy rolls up his sleves to show tuna how
[11:37:59] <guy> do you want me to show you how?
[11:38:13] <tuna> sure
[11:38:13] <guy> tell you what - i'll put easy instructions onto the forum for you
[11:38:24] <fspeculator> tuna
[11:38:25] <guy> do you have MSPaint on your computer?
[11:38:33] <fspeculator> i have a very very old sw called LViewpro
[11:38:52] <fspeculator> i just do alt-printscreen and just paste the buffer into lv
[11:38:57] <fspeculator> and save it as gif
[11:39:20] <guy> or if you don't want to install LV you can use MSPaint which is probably already on your machine
[11:39:38] <fspeculator> vwap 1197.5 ?
[11:39:55] <tuna> yes i have paint
[11:40:09] <guy> okay - i'm writing instructions...
[11:40:31] <fspeculator> most sw nowadays has ready post to dacharts/ftp
[11:40:37] <fspeculator> esignal does, ensign does
[11:40:41] <fspeculator> maybe qt already does
[11:41:53] <tuna> prolly easy,,,if u know how
[11:41:59] <tuna> and i dont
[11:42:36] <mashhad> well guys, i am taking off... c u all Tuesday
[11:42:56] <tuna> bye mash
[11:59:49] <guy> tuna: here you go: Easy Instructions to Post a chart
[12:00:52] <guy2>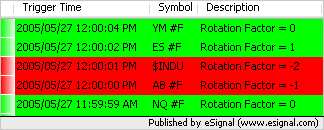
[12:01:43] <guy> hey fspec: just got a chance to look at your image
[12:01:58] <guy> not much range in ES - i agree
[12:08:00] <guy> Exited 1/2 Long AB at 614.8 --> + 1
[12:10:42] <guy> [12:09:27] <guy> it's not a winner
[12:10:42] <guy> [12:09:36] <guy> that closed out the initial long at 614.8 at b/e
[12:10:42] <guy> [12:09:43] <guy> now i'm long only from 613.8
[12:30:58] <guy2>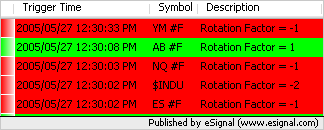
[12:30:59] <guy> ER2 is only mkt with positive rotation factor
[12:58:07] <guy> Exited all Long AB at 615.4 --> + 1.6
[12:58:14] <guy> have a good w/e everyone
[12:58:40] * Disconnected
Session Close: Fri May 27 12:58:49 2005
Post trading note the following day:
I regret that I had to leave early on Friday. The intent was to hold through for the rest of the day because the signals to the up side were very strong.
Actual results for the day are a little different to what you see above:
I made 1.6 points on 1 unit and 0 points on the other unit
The first unit was removed at break even.
The second unit was removed at a 1.6 point profit.
So commission paid on 2 units.
So 2 trades for total profit of 1.6 points.
I refer to unit as the base number of contracts traded, be it 1, 5, 10, 20, 100 etc.
Emini Day Trading /
Daily Notes /
Forecast /
Economic Events /
Search /
Terms and Conditions /
Disclaimer /
Books /
Online Books /
Site Map /
Contact /
Privacy Policy /
Links /
About /
Day Trading Forum /
Investment Calculators /
Pivot Point Calculator /
Market Profile Generator /
Fibonacci Calculator /
Mailing List /
Advertise Here /
Articles /
Financial Terms /
Brokers /
Software /
Holidays /
Stock Split Calendar /
Mortgage Calculator /
Donate
Copyright © 2004-2023, MyPivots. All rights reserved.
Copyright © 2004-2023, MyPivots. All rights reserved.