Friday 12-14-07
seems like we are opening in the buy zone of 85 -87 area..would prefer to see a run out of overnight low to get long...will be surprise if not enough power to take out the 90.50 players on upside
if you look at the IB this morning in relation to the gap size and prior day's range, it gives you a feel, I would not call todays IB as necessarily narrow by a strict interpretation, but in the context of the ranges we are talking about it was reasonably narrow, obviously going to be extended in either or both directions before the day (& week) ends.
Another way of looking at it is the 2xIB target folks use. Thus if the avg daily range is say 10 ES points, and the IB for a particular day is say 4 ES points, then 2xIB still falls within the average daily range. In this case its obvious the range will be extended significantly. Conversely lets say the IB is 8 ES points, using the same reasoning its not likely 2xIB will happen, best you might see is perhaps 1 or 2 ES points of range extension on one or both sides of the IB....essentially a quick sweep of stops and reversal at the IB boundary.
Another way of looking at it is the 2xIB target folks use. Thus if the avg daily range is say 10 ES points, and the IB for a particular day is say 4 ES points, then 2xIB still falls within the average daily range. In this case its obvious the range will be extended significantly. Conversely lets say the IB is 8 ES points, using the same reasoning its not likely 2xIB will happen, best you might see is perhaps 1 or 2 ES points of range extension on one or both sides of the IB....essentially a quick sweep of stops and reversal at the IB boundary.
Today's chart. Notice that the Single Print that formed on the way down was pierced by 1.25 points. The stops that I used when back testing Single Prints were 1 point so I would have been stopped out on this trade had I taken it. The market's also left a Single Print for us for Monday morning.
Click image for original size
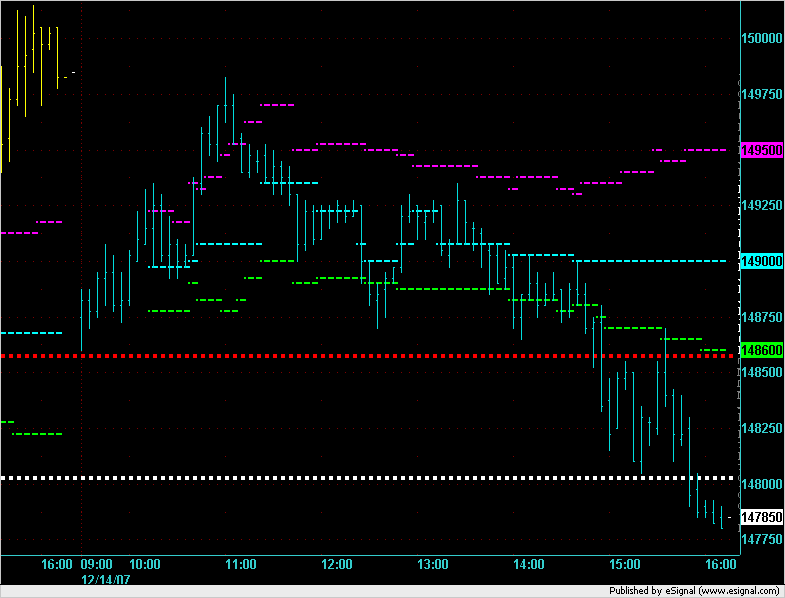
Here's the market profile from today. The Single Print left at the end of the day can probably be ignored because it was left by the last 15 minute bracket on a Friday.
[1498.25] G

[1498.00] G

[1497.75] G

[1497.50] G

[1497.25] G

[1497.00] FG

[1496.75] FG

[1496.50] FG

[1496.25] FG

[1496.00] FG

[1495.75] FG

[1495.50] FG

[1495.25] FG

[1495.00] FGH [DVAH]

[1494.75] FGH

[1494.50] FGH

[1494.25] FGH

[1494.00] FGH

[1493.75] FGH

[1493.50] EFGHK

[1493.25] EFHK

[1493.00] EFHJK

[1492.75] EFHIJKL

[1492.50] EFHIJKL

[1492.25] EFHIJKL

[1492.00] EFHIJKL

[1491.75] EFHIJKL

[1491.50] EFHIJKL

[1491.25] EFHIJKL

[1491.00] EFHIJKL

[1490.75] DEFHIJKL

[1490.50] DEFHIJKL

[1490.25] DEFHIJKLM

[1490.00] DEFHIJKLMN [DPOC]

[1489.75] DEFIJKLMN

[1489.50] DEFIJLMN

[1489.25] DEFIJLMN

[1489.00] DEIJLMN

[1488.75] DEJLMN

[1488.50] DEJLMN

[1488.25] DEJMN

[1488.00] DEJMN

[1487.75] DJMN

[1487.50] DJMN

[1487.25] DJMN

[1487.00] DJMNQ

[1486.75] DMNQ

[1486.50] DMNQ

[1486.25] DNQ

[1486.00] DNQ [DVAL]

[1485.75] NQ

[1485.50] NPQ

[1485.25] NPQ

[1485.00] NPQ

[1484.75] NPQ

[1484.50] NPQ

[1484.25] NPQ

[1484.00] NPQ

[1483.75] NPQ

[1483.50] NPQ

[1483.25] NPQ

[1483.00] PQ

[1482.75] PQ

[1482.50] PQ

[1482.25] PQ

[1482.00] PQ

[1481.75] PQ

[1481.50] PQ

[1481.25] PQ

[1481.00] PQ

[1480.75] PQ

[1480.50] PQ

[1480.25] Q

[1480.00] Q

[1479.75] Q

[1479.50] Q

[1479.25] QR

[1479.00] QR

[1478.75] QR

[1478.50] QR

[1478.25] R

[1478.00] R
quote:
Originally posted by pt_emini
narrow ib: I don't have a specific formula or statistics on the topic, I go by feel... lol
perhaps DT has some statistics ?
PT: If you load the IBTool from the ToolPack into an ES chart which has a time frame of 1 hour or less you will see a button in the lower left hand corner called IB Info. If you click this then you will see a dialog popup like this:
Click image for original size
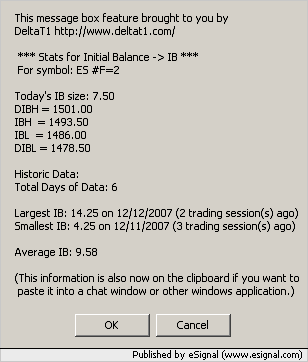
It will also copy this info to your clipboard in case you want to post it into the forum:
 *** Stats for Initial Balance -> IB ***

 For symbol: ES #F=2


Today's IB size: 7.50

DIBH = 1501.00

IBH  = 1493.50

IBL  = 1486.00

DIBL = 1478.50


Historic Data:

Total Days of Data: 6


Largest IB: 14.25 on 12/12/2007 (2 trading session(s) ago)

Smallest IB: 4.25 on 12/11/2007 (3 trading session(s) ago)


Average IB: 9.58
Also, if you set the time frame to a longer duration it will calculate the IB stats over a longer period of time. I set the timeframe to 30 days and it came up with these stats for today in the ES:
 *** Stats for Initial Balance -> IB ***

 For symbol: ES #F=2


Today's IB size: 7.50

DIBH = 1501.00

IBH  = 1493.50

IBL  = 1486.00

DIBL = 1478.50


Historic Data:

Total Days of Data: 29


Largest IB: 16.25 on 11/20/2007 (17 trading session(s) ago)

Smallest IB: 4.25 on 12/11/2007 (3 trading session(s) ago)


Average IB: 10.12
I like the thought process on this PT...very constructive.....thanks
quote:
Originally posted by pt_emini
if you look at the IB this morning in relation to the gap size and prior day's range, it gives you a feel, I would not call todays IB as necessarily narrow by a strict interpretation, but in the context of the ranges we are talking about it was reasonably narrow, obviously going to be extended in either or both directions before the day (& week) ends.
Another way of looking at it is the 2xIB target folks use. Thus if the avg daily range is say 10 ES points, and the IB for a particular day is say 4 ES points, then 2xIB still falls within the average daily range. In this case its obvious the range will be extended significantly. Conversely lets say the IB is 8 ES points, using the same reasoning its not likely 2xIB will happen, best you might see is perhaps 1 or 2 ES points of range extension on one or both sides of the IB....essentially a quick sweep of stops and reversal at the IB boundary.
Of course now the next logical question would be " What is the best measure of average daily range? " I've seen 5 day , 10 day, twenty day...etc..so this in itself becomes subjective...
quote:
Originally posted by pt_emini
Thus if the avg daily range is say 10 ES points, and the IB for a particular day is say 4 ES points, then 2xIB still falls within the average daily range. In this case its obvious the range will be extended significantly. Conversely lets say the IB is 8 ES points, using the same reasoning its not likely 2xIB will happen, best you might see is perhaps 1 or 2 ES points of range extension on one or both sides of the IB....essentially a quick sweep of stops and reversal at the IB boundary.
This was a cool area DT,,,we had the hour low break down and a key zone from Thursday also...classic Support to resistence....it seems that some kind of price action entry or an entry that is derived from buying pressure "drying" up in general would be a better way to go in hindsight....
I've never found anyone that can read Time/sales, the DOM etc at these price points to see if we could get an edge...Does your bid/ask indicator show anything at these key price zones???
PT do you or did you see anything that would tip us off that the singles would get filled in and the sellers where stepping back in...? I know you watch T/s for brief periods of time.....anyone??
quote:
Originally posted by day trading
Today's chart. Notice that the Single Print that formed on the way down was pierced by 1.25 points. The stops that I used when back testing Single Prints were 1 point so I would have been stopped out on this trade had I taken it. The market's also left a Single Print for us for Monday morning.
Click image for original size
I separate it into 3 types of day:
narrow
normal
wide
narrow
normal
wide
quote:
Originally posted by BruceM
Of course now the next logical question would be " What is the best measure of average daily range? " I've seen 5 day , 10 day, twenty day...etc..so this in itself becomes subjective...
I have T&S always visible for the CME e-mini's (ES,NQ,ER2) , i tend to ignore the YM and prefer keeping a small chart of the cash dow visible instead. Unlike most traders, I do not filter my T&S. I also keep a T&S of the $Tick up next to the others.
I watch how the T&S runs in relation to key price levels from my charts, and also whenever a short term trend change signal is given by my method, these usually coincide with key levels of the $Tick. I have certain expectations for price action as certain things setup and occur.
I never sit and watch just T&S without a frame of reference or context within which to interpret the price action.
T&S is very powerful and is without a doubt the fastest "indicator" I am aware of or have seen / used.
quote:
Originally posted by BruceM
This was a cool area DT,,,we had the hour low break down and a key zone from Thursday also...classic Support to resistence....it seems that some kind of price action entry or an entry that is derived from buying pressure "drying" up in general would be a better way to go in hindsight....
I've never found anyone that can read Time/sales, the DOM etc at these price points to see if we could get an edge...Does your bid/ask indicator show anything at these key price zones???
PT do you or did you see anything that would tip us off that the singles would get filled in and the sellers where stepping back in...? I know you watch T/s for brief periods of time.....anyone??
Emini Day Trading /
Daily Notes /
Forecast /
Economic Events /
Search /
Terms and Conditions /
Disclaimer /
Books /
Online Books /
Site Map /
Contact /
Privacy Policy /
Links /
About /
Day Trading Forum /
Investment Calculators /
Pivot Point Calculator /
Market Profile Generator /
Fibonacci Calculator /
Mailing List /
Advertise Here /
Articles /
Financial Terms /
Brokers /
Software /
Holidays /
Stock Split Calendar /
Mortgage Calculator /
Donate
Copyright © 2004-2023, MyPivots. All rights reserved.
Copyright © 2004-2023, MyPivots. All rights reserved.