How I day trade
There are 3 things that I look at when entering a trade:
If you enter near your exit stop then you risk very little on each trade.
Location
Traders use many tools to find a location for entry. I mainly use Market Profile. Others use Pivot Points, Fibonacci and visually identified support and resistance areas.
Direction
You need to be convinced that the market will move in the direction that you are about to enter your trade. I use a proprietary indicator called Alpha for this which gives me both direction and strength of possible move. You can use an oscillator or momentum or other indicator for this information. You need to find something the suits your style and personality. What works for fellow traders might not work for you.
Timing
If you are entering a counter-trend trade then it is best to enter on market excess - when the market has overshot and over-reacted and there is a high chance of a pullback. Because I trade the equity indices I use $TICK to measure this. I have an indicator that I have created that keeps track of $TICK through the day and tells me when $TICK has reached an extreme and plots that on the chart for me and rings a bell to warn me. I call this indicator TimerA1.
- Location
- Direction (including strength of conviction in that direction)
- Timing
If you enter near your exit stop then you risk very little on each trade.
Location
Traders use many tools to find a location for entry. I mainly use Market Profile. Others use Pivot Points, Fibonacci and visually identified support and resistance areas.
Direction
You need to be convinced that the market will move in the direction that you are about to enter your trade. I use a proprietary indicator called Alpha for this which gives me both direction and strength of possible move. You can use an oscillator or momentum or other indicator for this information. You need to find something the suits your style and personality. What works for fellow traders might not work for you.
Timing
If you are entering a counter-trend trade then it is best to enter on market excess - when the market has overshot and over-reacted and there is a high chance of a pullback. Because I trade the equity indices I use $TICK to measure this. I have an indicator that I have created that keeps track of $TICK through the day and tells me when $TICK has reached an extreme and plots that on the chart for me and rings a bell to warn me. I call this indicator TimerA1.
What is $Tick and what does it measure?
I'm developing an account using MP. I use Trade Maven and watch the volume at target areas. If big lots are buying or selling dictate which way it usually turns.
Here is an explanation of $TICK and how it is calculated and used by market technicians:
http://www.deltat1.com/Education/articles/Indicators.htm
http://www.deltat1.com/Education/articles/Indicators.htm
quote:What are you trading? ES? Have you been succesful with that methodology.
Originally posted by luke24.5
I'm developing an account using MP. I use Trade Maven and watch the volume at target areas. If big lots are buying or selling dictate which way it usually turns.
I tried some back testing with the "bluffer" theory. The tests were to determine if you could make money by fading or going with the big bids/offers. The results of the tests that I ran (on the ES) showed no bias to direction after large bids/offers were seen on the inside bid/offer.
It looks like you are monitoring traded volume and not bid size like I've just mentioned though. Is that right?
TM has a BISP calculator (NYSE or NQ) which measures # of stocks up/down and same with volume. It helps evaluate, but I've quit relying on it too much. I like looking for big traders to enter the market. When you see a series of trades in ER of 20+ contracts or the infrequent triple digit trade, I seem to do better.
I'm just dabbling PT in the Russell for now. Hopefully by the end of the year I can go FT.
I use Esig MP, 3M & Daily candles. On TM I use a 30 sec chart w/ volume bars, = the Institutional Volume Filter that shows all trades of 10 lots or more. It keeps tabs of vol %, such as 53% Buy/ 47% sell. You can refresh it at every point of congestion or target area to watch closely whether the Buyer or Sellers are winning.
One thing I'm convinced of is that MP is the best indicator of where reversals should occur.
I've never seen a BISP calculator but I believe that BISP stands for Buying Interest Selling Pressure right? What is different in the BISP to the $ADD symbol in eSignal?
I agree with your comments about volume. I have 2 Time and Sales windows up all the time. One with ES and the other with ER2 and I adjust the minimum contract size depending on the day. If it's a low volume day then I'll drop the minimum contract size that I see. Very useful to see the 400+ contracts go through on the ES because that usually cascades into the ER2 market about 5 to 15 seconds later.
It looks like you have a good bunch of tools and a very logical approach to using them. I spent a while study volume based charts but could not find any advantage to using them over time based charts.
Not familiar with $ADD. BISP was developed by Bill Duryea and has been incorporated into TM. Measures total volume B/S and # of stocks that are up or down. If NYSE overall is under 70% in either direction it's probably not going to be a trend day. However I got killed using it on days that trended on the index I was trading when overall the NYSE wasn't. I generally just watch vol on what I'm trading now with an occassional glance at BISP.
BTW, the Institutional Volume Filter is measuring actual trades as you suspected. If the market doesn't go the way of the big trades soon, then get out of the way of the train.
I also look for tails on the candles to confim.
BTW, the Institutional Volume Filter is measuring actual trades as you suspected. If the market doesn't go the way of the big trades soon, then get out of the way of the train.
I also look for tails on the candles to confim.
I found this image of a BISP calculator on the web. Is this what you're using? It looks very similar to the TRIN indicator which is (# advancing issues/# decling issues)/(vol advancing/vol declining)
Click image for original size
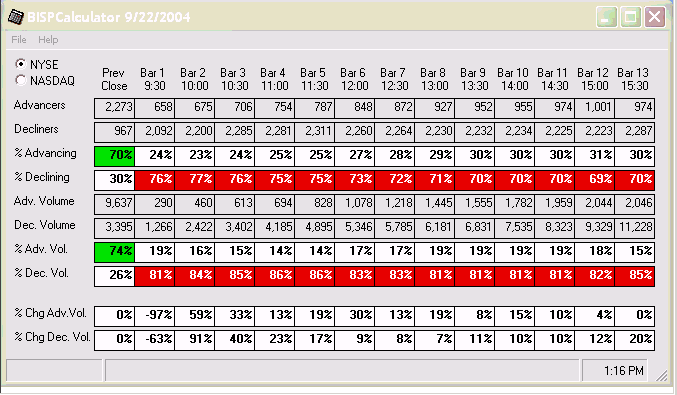
That's it. I find that I'm better off watching the volume filter though. An occassional glance at BISP just to see how the whole market is doing.
Another tool that goes along with it is a bar analysis tool. It compares volume of 30 minute bars with the average for that same time frame over the last 20 days. If you get a move longer than average for a bar but on statistically low volume it probably is not going to follow through. I find that a little more valuable than the BISP.
Bill Duryea developed and used those tools for trading ES by Market Profile. Now they've been incorporated into TradeMaven but I think they both still require Esignal.
Luke: You have some very interesting tools that I've never heard of. Are these all built into TradeMaven or are you using some on eSignal.
The current versus average volume is an interesting comparison. Do they plot on the same chart? And does the average bar length (perhaps height is a more appropriate word) for that bar plot next to the bar?
I can see that type of tool being useful.
I'm just about to start work on an indicator panel to bring together a number of buy/sell/flat indicators that I use and line them up on a dashboard so that I can see what each one is doing at a glance and easily get a picture of the market.
One of the items will be the Rotation Factor from Market Profile and also lit up will be proximity (5 ticks in this case) to previous and current Value Areas and Single Prints.
Buying Interest Selling Pressure is available on Trademaven Professional.
I'm not positive that Esignal is required.
I'm not positive that Esignal is required.
Timing
Another way of measuring excess and timing an entry for a counter trend trade is to watch volume. Volume will frequently peak at turning points in the market. In fact, I'm fairly certain that it peaks more often than not - i.e. over 50% of the time. Measuring this is difficult and subjective and so I have not been able to quantify it but I remember when trying to do it by eye once I was under the impression that 3 out of ever 4 market turns were accompanied by excessive volume - 75%.
If you're not watching a time based chart then you need an indicator that will replicate volume - if for example you're watching a volume based chart. I use one called BarSpeed which tells me how fast the volume bars are forming and this shows excess buying or selling.
Getting in on the extreme is tricky and requires 7th dan video game reactions on your mouse. You also need to take partial profits quickly and move the stop aggressively to break-even.
Remember that this is only for manually entering a counter trend trade during a fast move in the market.
Emini Day Trading /
Daily Notes /
Forecast /
Economic Events /
Search /
Terms and Conditions /
Disclaimer /
Books /
Online Books /
Site Map /
Contact /
Privacy Policy /
Links /
About /
Day Trading Forum /
Investment Calculators /
Pivot Point Calculator /
Market Profile Generator /
Fibonacci Calculator /
Mailing List /
Advertise Here /
Articles /
Financial Terms /
Brokers /
Software /
Holidays /
Stock Split Calendar /
Mortgage Calculator /
Donate
Copyright © 2004-2023, MyPivots. All rights reserved.
Copyright © 2004-2023, MyPivots. All rights reserved.