Larry Williams darlings - help needed!!
I may have asked this before but I'm looking for an online stock screener ( preferably free) that can help me scan for LW's darlings.
We can debate the validity/credibility of Williams at another time but here is what they are:
The Darlings are the low priced DJIA stocks that have low price to sales and low FORWARD 12 month p/e ratios
Here is what I want to do:
I want to subtract the P/S and the price to cash flow ratio from the stocks dividend yield. The stocks with the highest figures are the ones to buy but as a final filter I want to take the top 5 - 7 stocks that have the LOWEST 12 month forward p/e ratios.
Whew !! You math guys are too much.
Any help would be appreciated..
Bruce
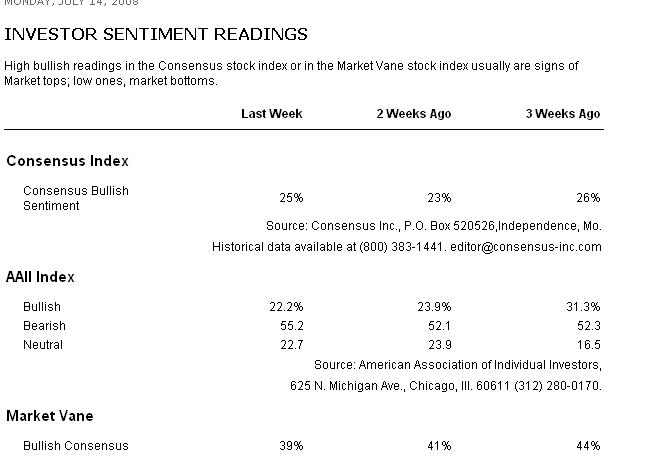
Barrons...not many folks are bullish as per surveys etc...
Click image for original size
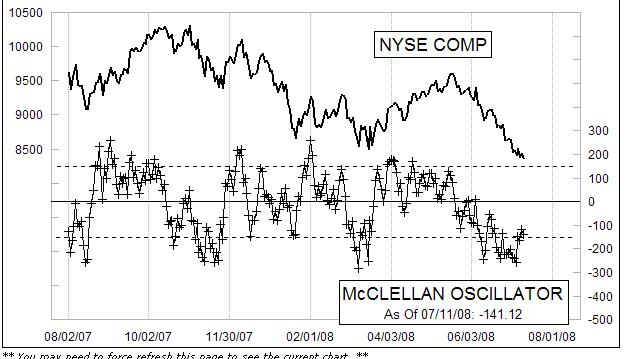
McClellan//Low reading lead to higher ones when other things line up
Click image for original size
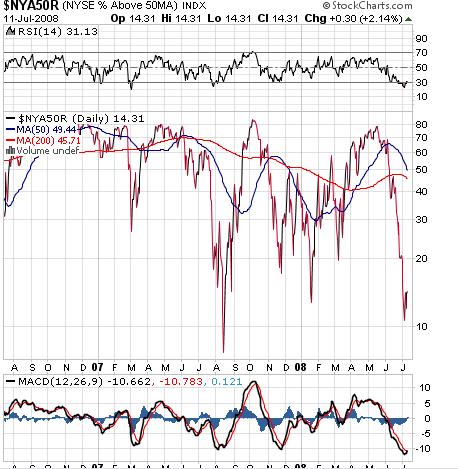
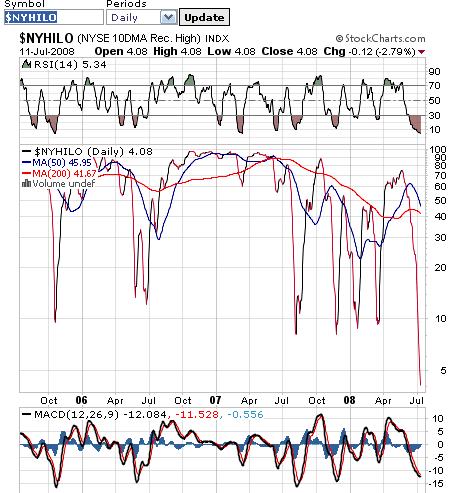
New lows in the gutter...will this travel back to above 70...? Sure but when ?
Click image for original size
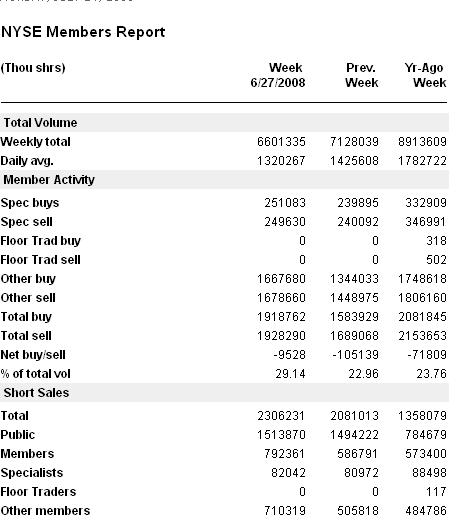
Public agressively shorting..almost twice as much as the specialists
Click image for original size
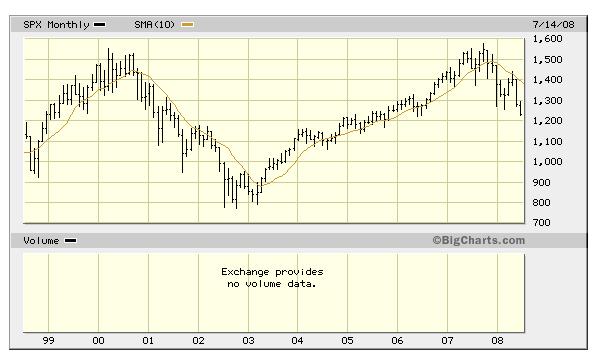
the ten month moving average has done a good job at controlling longer term trends which has been down since early 2008....BUT we usually snap back to test it when we extend too far away from it..
Click image for original size
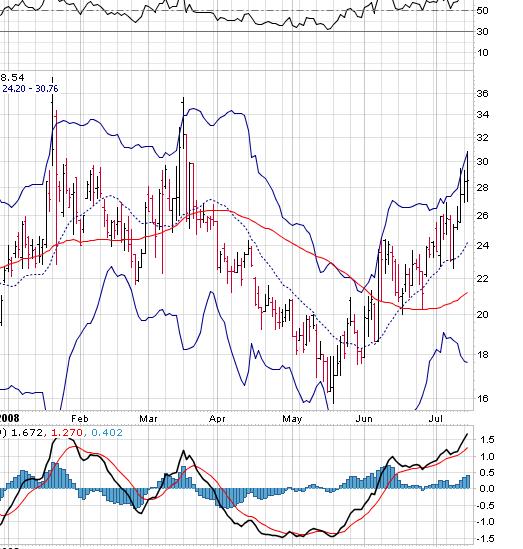
Last but not least is the Vix..everybody is talking about it and some say the low won't be in until we trade back up to the 35 area....I think we may roll over from up here at this 3 standard deviation band but so far I haven't done any better at calling a low than anyone else...
Click image for original size
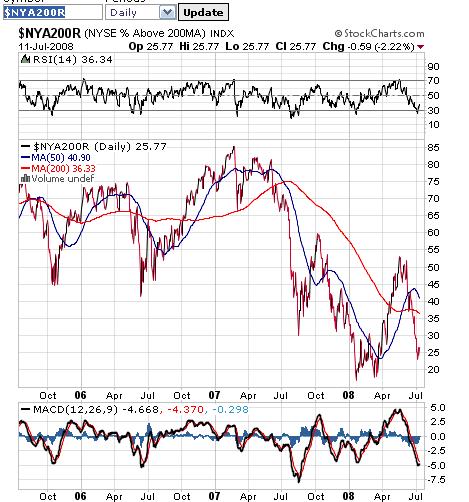
Hey, Bruce, nice work. You know what would be nice, if you could post a chart of that 'Percent of stocks above their 200 period MA' going back to before the start of the last bear, maybe back to at least '98, so we can see how it acted in the last bear and in the '98 turmoil, comparing apples to apples. As it is now the context has one comparing now to the recent bull action. It would be nice if you could also post a VIX chart going back as far as you can, so we can compare this to previous action. For example, in '98 the VIX spiked to over 60, and in '87, over 172 by TeleChart data (most sources say over 150). So, even though the recent spikes imply 35-40 would be a bottom, many bottoms have been a lot higher. Thanks, and thanks for the post. I love looking at sentiment readings.
Hi Jim,
I don't have that data but certainly would appreciate it if anyone can post what they have. The ideal way to trade any of this would be to wait for some kind of signal from the actual market averages themselves instead of going in "shotgun" like I have. No doubt the markets could fall further.
It seems that investors are trying to be more sophisticated and educated with the addition of the internet and I wonder if more are trading options in general which could possibly dillute the Vix as a method anyway. I believe the bulls or the bears could make a case down here but I also believe that there is so much more pressure on the government to "act" which could help my case for the longside. In other words they seem to act quicker even if it isn't always the correct course of action.
I'm looking at the entire collective picture and certainly am trying to factor in all the fear and "bears" on the internet. These charts are only a small fraction as it's hard to graph a "feeling" based on what we read or hear in the media.
I like the low readings from investment advisors a lot as it seems to be a closer reflection on the "mood". On many of the charts ( NOT SHOWN O/N SOME) I have the 3 standard deviation band which I like conceptually.
Your point is well taken though but I'm not really sure how to compare "apples to apples". We can look at a price chart and call a market a bear market based on a percentage drop from a high but that doesn't mean we have the same general mood on the street. Any advice in qualifying this is appreciated.
Thanks for the input.
Bruce
Thank you, Bruce!
Emini Day Trading /
Daily Notes /
Forecast /
Economic Events /
Search /
Terms and Conditions /
Disclaimer /
Books /
Online Books /
Site Map /
Contact /
Privacy Policy /
Links /
About /
Day Trading Forum /
Investment Calculators /
Pivot Point Calculator /
Market Profile Generator /
Fibonacci Calculator /
Mailing List /
Advertise Here /
Articles /
Financial Terms /
Brokers /
Software /
Holidays /
Stock Split Calendar /
Mortgage Calculator /
Donate
Copyright © 2004-2023, MyPivots. All rights reserved.
Copyright © 2004-2023, MyPivots. All rights reserved.