Larry Williams darlings - help needed!!
I may have asked this before but I'm looking for an online stock screener ( preferably free) that can help me scan for LW's darlings.
We can debate the validity/credibility of Williams at another time but here is what they are:
The Darlings are the low priced DJIA stocks that have low price to sales and low FORWARD 12 month p/e ratios
Here is what I want to do:
I want to subtract the P/S and the price to cash flow ratio from the stocks dividend yield. The stocks with the highest figures are the ones to buy but as a final filter I want to take the top 5 - 7 stocks that have the LOWEST 12 month forward p/e ratios.
Whew !! You math guys are too much.
Any help would be appreciated..
Bruce
Not to put Williams or anyone on a pedastel but I happened to see this right after my previous post....seems ole Larry is bullish now..you can judge for yourself. It will be interesting to see what happens from here...
http://www.ireallytrade.com/TVStation/LarryTV.html
as an aside: Yesterday was the second highest volume day in NYSE HISTORY....I'm surprised we didn't have a bigger decline....hopefully the smart money was accumulating for sake of these so called "darlings" of mine...is this me just justifying my trades? Could be!!
This method requires a lot of hope which I don't like....
It will be fun to see which stocks of the Dow actually rise the most when we finally do get a meaningful rally
this rally off the lows is suspicious to me...I'd prefer to see some minor backfill and then another big day up next week.....this is too obvious
I just couldn't do it////LOL
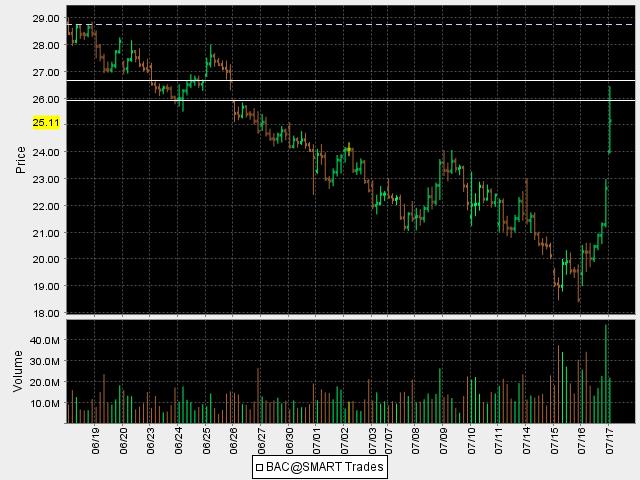
I sold all my shares of BAC at 25.58 for a profit of 4.25 per share...it traded back into a gap created on 6/25 and 6/26 and the stock was up 22% yesterday........I'm planning on buying this stock back if we roll over down..otherwise this darling will take off without me
It's hard to get away from day trading instincts
here is the chart.....this turned out to be a one week hold.....so far I'm not following any rules
Click image for original size
Bravo Bruce,
This up move seems suspicious to me as well. Well good investing/daytrading lol
This up move seems suspicious to me as well. Well good investing/daytrading lol
interesting how dow and S&P are making new highs on the day but BAC isn't....still, the fact remains that the markets are holding up well..I may not get the retrace to re buy this one
I covered the add on portion at 126.28.....almost 6 points per contract...
quote:
Originally posted by BruceM
I added spy at 120.40 today. I will consider this a failed experiment as I am just not able to sit back and watch without taking some action. The huge loss so far in BAC is a concern. Hence the SPY add - on
The darling I thought would be the most trouble and the one I sold the other day at 25 1/2 is trading up at 30 today. BAC is off to the races....I guess this type of trading is better left untouched until parameters get overbought on the indexes. Trouble is that sentiment doesn't seem to work as well at calling tops.
Has anyone here used the Rydex funds for going long or short?
Has anyone here used the Rydex funds for going long or short?
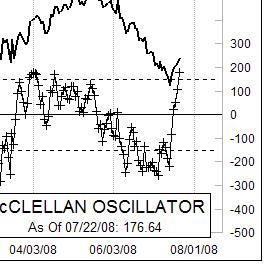
Here is the Summation index...many believe that a turn up from below minus 500 signals the new uptrend...
BUT i'm looking to further qualify by looking at the McClellan index itself.....A dip below minus 250 and then a reading above 175 starts new up moves but I've found we can still get a new low ( minor) and a divergence to set up the longside too
Click image for original size
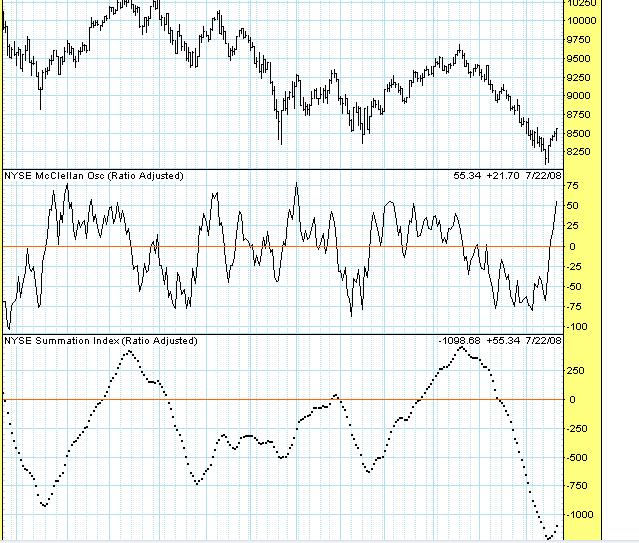
BUT i'm looking to further qualify by looking at the McClellan index itself.....A dip below minus 250 and then a reading above 175 starts new up moves but I've found we can still get a new low ( minor) and a divergence to set up the longside too
Click image for original size
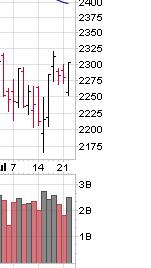
O'neil says that confirmation days usually happen on days 4 - 7 after a bottom and have higher volume then the day before with the one of the major indexes closing up over 1.5 %. Yesterday all closed over 1 % higher on higher volume but none achieved the 1.5 % threshold. I can't deny the powerful move of the Compx off its low yesterday but also think that a retest down is possible....
here is a closeup of the Compx..this would be a day 6 follow through..
here is a closeup of the Compx..this would be a day 6 follow through..
Click image for original size
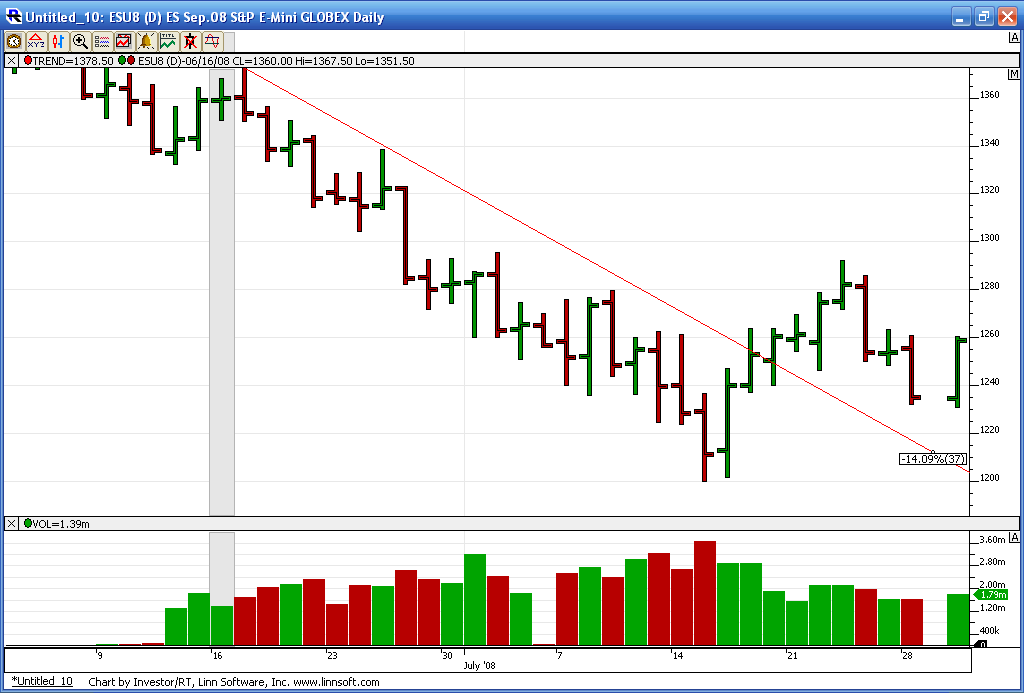
here is the possible 1-2-3 low i'm watching. All indexes closed over 2% higher today on volume greater then the preceeding two days. This chart kind of sucks but on it you can see the possible blow off volume at the lows, then the trendline break and the retest.
What needs to follow is a move up to break that number 2 point ( can't get the damn thing labelled in IRT tonight for some reason) and some closes above it. Perhaps this is too obvious for most to believe it's real. Anyway this is like an ongoing journal for me and hopefully this has some meaning beyond that. What I realy don't want to see is a break of those 1290 highs on poor volume and then a close below there. That could be trouble.
I should also point out the retest of the HIGH of the lowest bar on yesterdays low and today low.
I've read on-line that some think the bear market isn't mature enough to rally. Well, that could be but the Dow and S&P topped out in October of 2007 and haven't seen new highs since...That's almost 10 months ago. Just thinking out loud.
Bruce
Click image for original size
Thank you, Bruce!
Emini Day Trading /
Daily Notes /
Forecast /
Economic Events /
Search /
Terms and Conditions /
Disclaimer /
Books /
Online Books /
Site Map /
Contact /
Privacy Policy /
Links /
About /
Day Trading Forum /
Investment Calculators /
Pivot Point Calculator /
Market Profile Generator /
Fibonacci Calculator /
Mailing List /
Advertise Here /
Articles /
Financial Terms /
Brokers /
Software /
Holidays /
Stock Split Calendar /
Mortgage Calculator /
Donate
Copyright © 2004-2023, MyPivots. All rights reserved.
Copyright © 2004-2023, MyPivots. All rights reserved.