Larry Williams darlings - help needed!!
I may have asked this before but I'm looking for an online stock screener ( preferably free) that can help me scan for LW's darlings.
We can debate the validity/credibility of Williams at another time but here is what they are:
The Darlings are the low priced DJIA stocks that have low price to sales and low FORWARD 12 month p/e ratios
Here is what I want to do:
I want to subtract the P/S and the price to cash flow ratio from the stocks dividend yield. The stocks with the highest figures are the ones to buy but as a final filter I want to take the top 5 - 7 stocks that have the LOWEST 12 month forward p/e ratios.
Whew !! You math guys are too much.
Any help would be appreciated..
Bruce
quote:
Originally posted by BruceM
I may have asked this before but I'm looking for an online stock screener ( preferably free) that can help me scan for LW's darlings.
We can debate the validity/credibility of Williams at another time but here is what they are:
The Darlings are the low priced DJIA stocks that have low price to sales and low FORWARD 12 month p/e ratios
Here is what I want to do:
I want to subtract the P/S and the price to cash flow ratio from the stocks dividend yield. The stocks with the highest figures are the ones to buy but as a final filter I want to take the top 5 - 7 stocks that have the LOWEST 12 month forward p/e ratios.
Whew !! You math guys are too much.
Any help would be appreciated..
Bruce
Hi, Bruce.
Maybe this might help? http://finviz.com/screener.ashx?v=111&f=idx_dji&ta=1&p=d&r=1
Thanks so much for this. Looks like a cool scanner.
Bruce
Bruce
quote:
Originally posted by BruceM
Thanks so much for this. Looks like a cool scanner.
Bruce
You bet. It was a token of my appreciation for inspiring me to create a new strategy of my own.
I realize the seasonal instrinsic value of the dogs and the darlings, and Larry's adaptation is interesting, and likely even less aggressive than simply going on the highest dividend yield, though in either there isn't a debt to equity ratio factored nor despite the P/S and P/CF, both of which can be manipulated and padded by accountants, is there any objective indication to value of a corporation outside of relative value. A debt restructuring effort after an order is placed can be too little too late in an attempt to manage risk. And the plan is to buy at a bottom and hold until May. No other stop-loss or target strategy is implemented. Vis-a-vis: loss and emotionally-charged ultimatums equates to poor decisions, like not making one to exit.
Therefore I propose eliminating the forward P/E in favor of balancing the last two and present two quarters: an earnings multiple (add the previous two quarters and two projected quarters together). I like the P/S and P/CF to be subtracted from the dividend yield. It's a great idea. Though add another feature, a discounted projected cash flow to equity ratio model. I know it's not easy, and it requires the actual statements, but you can eliminate the less attractive stocks gathered and reaserch only a few. Then only pick stocks that have a higher percentage of worth above the current trading price, and choose from there. It could turn out that they're not a value at all and then you'ld be glad you did your research.
There's plenty of time before October, (and being election year, the best time is now to begin finding value companies before markets and traders go nuts in the Fall.)
http://www.investopedia.com/university/dcf/
And sell in May and go away.
Bruce @ ThinkorSwim we have the stockerhacker / sizzleindex, not sure this is what your looking for as you indicated something free; an account is required, after that there is no fee.
Thanks for the help from both of you. Now I need some input on the actual timing ! These longer term trends baffle me. Anything outside of an intraday period is so difficult for me...
So williams likes to time these purchases but looking at his website etc it seems he isn't always waiting until October for entry and will revise his exit time to which brings up my next question:
What do most feel is a good indicator/signal that we have hit bottom or have reach a top? some ideas:
Mutual fund cash positions - seems out dated
% of stocks above / below 200 and 50 day moving averages
put/call ratio
Nyse and S&P % bullish
where does it end and what actual works for a longer term trend?
Some of these are almost in the buy zones now !!
Any advice is appreciated
Bruce
Today I bought what I considered to be the "darlings". Most are currently out of favor but more important to me is that sentiment is very bearish. I wasn't waiting until October as I Think sometimes this timing model gets a bit out of whack and Willimas himself doesn't stick to that time frame. I also bought the SPY at 124.39. All of the stocks where bought in equal dollar amounts. I'll keep the forum posted as this unfolds. I will re-evaluate when/if sentiment gets back into bullish overbought areas. This is longer term and I have no stops.
Here are the stocks followed by the fill prices...comments are welcome
BAC 21.33 ( I think this one is the highest risk and has highest loss potential)
HD 22.17
VZ 34.73
PFE 18.19
GE 27.38
All are higher yield, low P/e and low price to sales......an additional filter I used was the 12 month forward P/e's which I screened for being low also.
What will be most interesting for me will be my ability to watch these stocks without actively trade them. That will be the challenge, the ability ( or inability) to shut off my day trader impulses.
Bruce
The interesting thing for me so far is the element of TIME. With a position like this you have plenty of time to negate and justify your position.
I have plenty of time to get opinions, read the internet, financial papers etc. While the whole world acts as if we are crumbling I am sticking to my position and today the put call finally went over one (1) and the market is trying to hold up as oil makes new highs and fanny and freddie go into crisis. No doubt that lots of bearishness is out there.
Many feel that the VIX hasn't signified enough fear yet as it hasn't traded up into the 35 area. I'm looking at standard deviations of this volatility indicator set to 3 .
So it seems as if I am justifying my trade and perhaps I am. I just don't see a technical reason to actually hold shorts down in here. It would be great to hear from some of the bears and compare notes as to why you are justifying your stance on the market.
It seems that the market is showing some strength as we are only 2 S&P points ( 1241 as I type at 3:58 eastern time)below the low of that huge down day on Wednesday. That doesn't seem like a market that is selling off.
I'd like to see one of those classic O'neil up days that actually holds next week but I'm not going to expect any "V" bottom to form. It will probably take TIME.
Bruce
one thing Williams never addresses ( and may not use for the darlings) is a stop loss as this is based on time alone. So far my "Darlings" are showing me no love....and are under water with the rest of the market....Will today be the day we have the final flush with futures down at 1212 in overnight? Sure wish I knew. So far I'm not enjoying this real money experiment.
I added spy at 120.40 today. I will consider this a failed experiment as I am just not able to sit back and watch without taking some action. The huge loss so far in BAC is a concern. Hence the SPY add - on
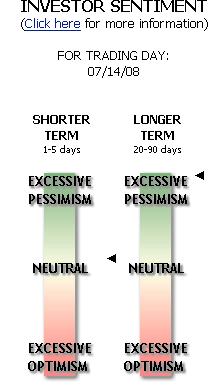
I'm uploading a bunch of indicators/screenshots I've been looking at the past week which has made me actually bullish. I'll hopefully be able to give some explainations at a later date but feel free to make your own comments..I'm basically going the opposite of what the crowd thinks
First is from the website sentimentrader.com I just look at front page..
First is from the website sentimentrader.com I just look at front page..
Click image for original size
Thank you, Bruce!
Emini Day Trading /
Daily Notes /
Forecast /
Economic Events /
Search /
Terms and Conditions /
Disclaimer /
Books /
Online Books /
Site Map /
Contact /
Privacy Policy /
Links /
About /
Day Trading Forum /
Investment Calculators /
Pivot Point Calculator /
Market Profile Generator /
Fibonacci Calculator /
Mailing List /
Advertise Here /
Articles /
Financial Terms /
Brokers /
Software /
Holidays /
Stock Split Calendar /
Mortgage Calculator /
Donate
Copyright © 2004-2023, MyPivots. All rights reserved.
Copyright © 2004-2023, MyPivots. All rights reserved.