Larry Williams darlings - help needed!!
I may have asked this before but I'm looking for an online stock screener ( preferably free) that can help me scan for LW's darlings.
We can debate the validity/credibility of Williams at another time but here is what they are:
The Darlings are the low priced DJIA stocks that have low price to sales and low FORWARD 12 month p/e ratios
Here is what I want to do:
I want to subtract the P/S and the price to cash flow ratio from the stocks dividend yield. The stocks with the highest figures are the ones to buy but as a final filter I want to take the top 5 - 7 stocks that have the LOWEST 12 month forward p/e ratios.
Whew !! You math guys are too much.
Any help would be appreciated..
Bruce
I just sold all these at 27.17...I have a key area in the ES futures at 78 - 81 and we are going up against that now....I'm hoping we get some higher trade to put this trade back on....remember these are inverse so if the market declines then these shares go up in priceOverall a good trade!
Originally posted by BruceM
I just added to this - SDS at 25.98
Nice trade Bruce and good planning.
Originally posted by BruceM
I just sold all these at 27.17...I have a key area in the ES futures at 78 - 81 and we are going up against that now....I'm hoping we get some higher trade to put this trade back on....remember these are inverse so if the market declines then these shares go up in priceOverall a good trade!Originally posted by BruceM
I just added to this - SDS at 25.98
Here is a fib showing a potential area of support. If prices bust down through this zone 78-80 it would suggest a larger projection down is needed.
Click image for original size

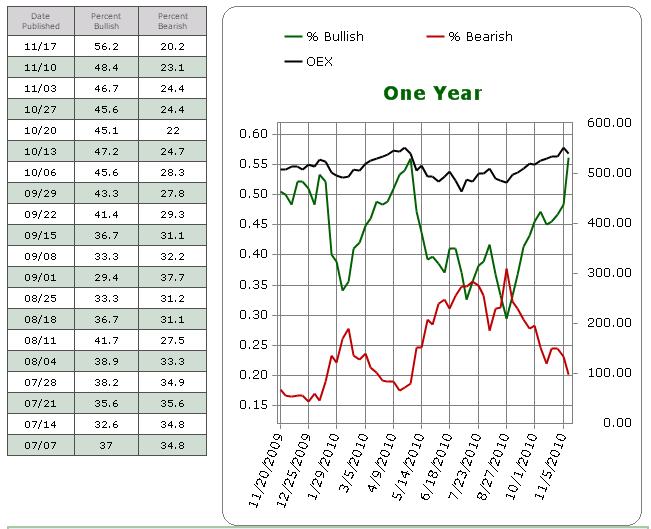
Yesterday Investors intelligence had 56.2 % bulls and 20.2 % bears.....a spread of over 30%.....this is usually not good for the longer term. Market Vane is usually geared towards the short term and many are pointing to Market Vane backing off from it's High bullish percent as a good sign for the bulls...
I think they are wrong and the smart money is selling into this rally...I bought more SDS today at 26.40. We'll see from here..perhaps we may rally a bit. The volume I track showed 94% down volume the other day which often ( but not always) leads to a pop up in prices for 2 - 3 days). Today we had a nice pop up with 87% up volume...still less then the down volume...
I still think this market had plenty of downside left....lets see what tonight and tomorrow bring with options expiration.
here is the II sentiment.....
Click image for original size
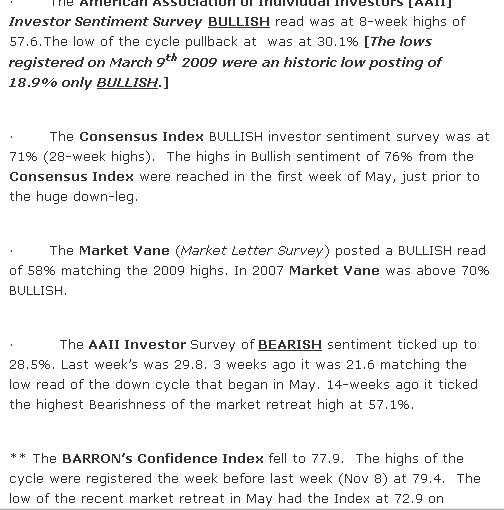
someone summed up sentiment on the 15th of November:
Click image for original size
Sentiment is even more bullish ( which hopefully is bearish for the market) and I still have my SDS shares...my plan is to add if we trade above 1250 by weeks end of an option expiration week. Other part of the plan is to see where we are at the end of January if we don't get the big sell off or at least start correcting..
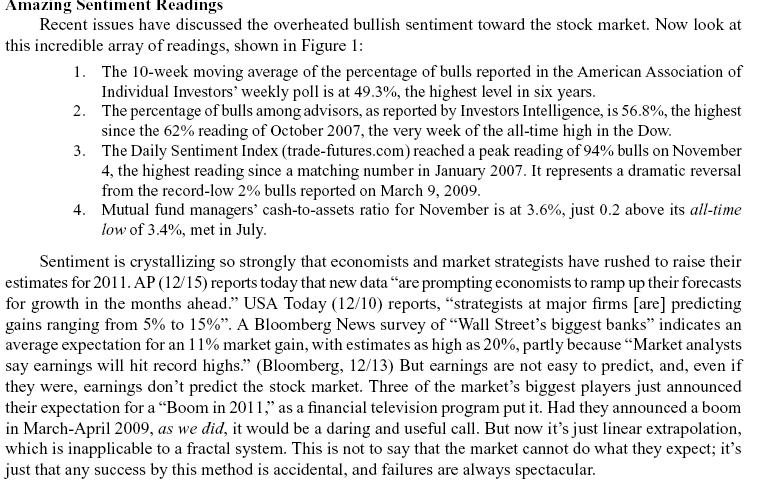
here is the latest stuff on sentiment:
Perhaps the bulls will win and this will be another failed experiments!
here is the latest stuff on sentiment:
Click image for original size
Perhaps the bulls will win and this will be another failed experiments!
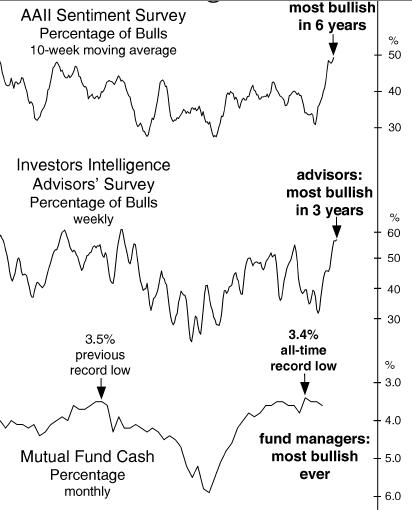
here is one more visual:
Click image for original size
one last thing...have you checked the prices at the gas pump.......also not a great sign for the bulls...
have been tracking all of the conventional sentiment interpretations, internals non-confirming the recent move up ... and then there's the close to "perfect" Elliot Waver's 5th wave move up ... and I'm wondering (and with so many EW and other advice services calling this the TOP with a subsequent big time down move into the rest of eternity) ... is the OBVIOUS from historical patterns as valid as in the past? Close to a Hindenberg Omen thingy too as well so it seems. Anyway, would be nice to get thoughts on this from others since a thing or phenomenon in the market, once recognized by all, loses its relevance and predictive ability to at least some extent. Perhaps it's gonna be totally different or maybe a variation in the Mark Twain sense of "history doesn't reapeat but rhymes" type thing. I think the majority of market participants, from every time frame of trading, have been caught off guard more recently by this very thing.
Am totally open to comments and being told I'm an absolute idiotic ass who doesn't know a bar chart from a hole in my account.
The Uncertain and Questioning Monkey
Am totally open to comments and being told I'm an absolute idiotic ass who doesn't know a bar chart from a hole in my account.
The Uncertain and Questioning Monkey
Thank you, Bruce!
Emini Day Trading /
Daily Notes /
Forecast /
Economic Events /
Search /
Terms and Conditions /
Disclaimer /
Books /
Online Books /
Site Map /
Contact /
Privacy Policy /
Links /
About /
Day Trading Forum /
Investment Calculators /
Pivot Point Calculator /
Market Profile Generator /
Fibonacci Calculator /
Mailing List /
Advertise Here /
Articles /
Financial Terms /
Brokers /
Software /
Holidays /
Stock Split Calendar /
Mortgage Calculator /
Donate
Copyright © 2004-2023, MyPivots. All rights reserved.
Copyright © 2004-2023, MyPivots. All rights reserved.