Market Profile calculator
I was checking out the beta Market profile calculator. great idea btw, but I could not get it to work. I trade the ES and there is numbers set up for the ES. It says to enter the Raw high/Low data here. When I do, the profile does not appear to be correct. Any thoughts are appreciated
Printer
Printer
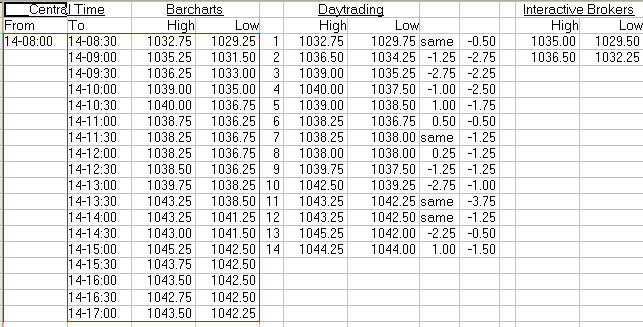
The input data that you have for 14 Sep looks different to mine: 9:30 to 16:00 EST
102975	103275

103425	103650

103525	103900

103750	104000

103850	103900

103675	103825

103800	103825

103800	103800

103750	103975

103925	104250

104225	104325

104250	104325

104200	104525

104400	104425
Yes, it does!
I took it from barcharts.com
http://charts.barchart.com/chart.asp?sym=ESZ9&data=Z30&jav=adv&vol=Y&divd=Y&evnt=adv&grid=Y&late=y&code=BSTK&org=stk&fix=
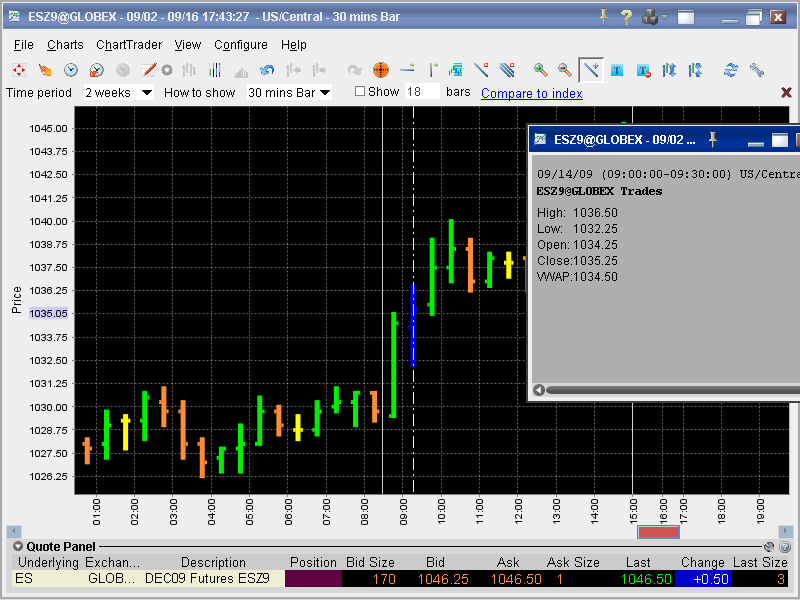
Then after reading your message I pulled up IB chart and data.
it looks different again.
e.g. in CT
8:30-9:00 1035.00 1029.50
9:00-9:30 1036.50 1032.25
Frustrating.
I took it from barcharts.com
http://charts.barchart.com/chart.asp?sym=ESZ9&data=Z30&jav=adv&vol=Y&divd=Y&evnt=adv&grid=Y&late=y&code=BSTK&org=stk&fix=
Then after reading your message I pulled up IB chart and data.
it looks different again.
e.g. in CT
8:30-9:00 1035.00 1029.50
9:00-9:30 1036.50 1032.25
Frustrating.
Click image for original size
Click image for original size
quote:(Page1 of thread)
Originally posted by day trading
Brackets are the 30 minute bars during the Regular Trading Session (RTH). So there are typically 13 of those for the E-mini S&P500 from 9:30a to 4:15p ET so you'd need to enter 13 lines in the calculator with 2 numbers on each line, just like the sample data that's already on that page...
quote:(Page3 of thread)
Originally posted by day trading
The input data that you have for 14 Sep looks different to mine: 9:30 to 16:00 EST ...
Looking at your data for 14-Sep-2009 it looks like you used 14 bars of input data. Would 9:30 to 16:00 ET give 13 bars?
thanks
I usually include the last 15 minutes from 16:00 to 16:15 as the last bracket.
quote:
Originally posted by day trading
I usually include the last 15 minutes from 16:00 to 16:15 as the last bracket.
Thanks. What are the plus and minuses of doing that?
It captures the closing volume and also the trades that have to be closed before the end of day because of various limit or strategy restrictions (or mandates).
quote:
Originally posted by Rockard
What is the Market Profile Calculator and where I can I look at it?
It takes 30 minute highs and lows of the market during the Regular Trading Hours (RTH) and creates a Market Profile of letters out of it.
You can look at it here: Market Profile Calculator
Thanks for that Day Trading. Is there a way to get the calculator into an excel spreadsheet, so that I can play around with it a bit. I trade the Australian index market.
I have been doing manual MP charts in excel, but the calculator would make things a lot easier.
Thanks again
I have been doing manual MP charts in excel, but the calculator would make things a lot easier.
Thanks again
It's not available in Excel unfortunately.
Some traders ignore the last bracket but I believe that most traders include it. I think that you should include it as there is significant day trading closing out that happens in that bracket.
Emini Day Trading /
Daily Notes /
Forecast /
Economic Events /
Search /
Terms and Conditions /
Disclaimer /
Books /
Online Books /
Site Map /
Contact /
Privacy Policy /
Links /
About /
Day Trading Forum /
Investment Calculators /
Pivot Point Calculator /
Market Profile Generator /
Fibonacci Calculator /
Mailing List /
Advertise Here /
Articles /
Financial Terms /
Brokers /
Software /
Holidays /
Stock Split Calendar /
Mortgage Calculator /
Donate
Copyright © 2004-2023, MyPivots. All rights reserved.
Copyright © 2004-2023, MyPivots. All rights reserved.