Market Profile calculator
I was checking out the beta Market profile calculator. great idea btw, but I could not get it to work. I trade the ES and there is numbers set up for the ES. It says to enter the Raw high/Low data here. When I do, the profile does not appear to be correct. Any thoughts are appreciated
Printer
Printer
What is it coded in. are there ways to edit the way it is presented?
quote:
Originally posted by Rockard
What is it coded in. Are there ways to edit the way it is presented?
It's written in C#. How would you change the presentation?
quote:Hello,
Originally posted by day trading
quote:
Originally posted by Rockard
What is it coded in. Are there ways to edit the way it is presented?
It's written in C#. How would you change the presentation?
First let me say that I'm a huge fan of you work on these pages. I haven't been very active, but always read all the posts.
I saw recently that you have coded the MP calculator in C#, as I'm having a similar project in mind for personal use I would really love to see your code for the calculator if you are willing to share with a fellow programmer and market profile enthusiast.
Originally posted by day trading
Brackets are the 30 minute bars during the Regular Trading Session (RTH). So there are typically 13 of those for the E-mini S&P500 from 9:30a to 4:15p ET so you'd need to enter 13 lines in the calculator with 2 numbers on each line, just like the sample data that's already on that page. I'm not sure how you copy data from a 30 minute chart in Tradestation as I don't use it. Anybody reading this that knows the answer to copy/past data from Trade Station?
do you include the 30 min bracket from 4:00 to 4:30 p.m. or not because the RTH ends at 4:15?
Also is the tick size always 0.25 for futures and cash indexes.
What is the tick size and decimal place for FOREX(eur/usd,...)?
Originally posted by clintwer
Originally posted by day trading
Brackets are the 30 minute bars during the Regular Trading Session (RTH). So there are typically 13 of those for the E-mini S&P500 from 9:30a to 4:15p ET so you'd need to enter 13 lines in the calculator with 2 numbers on each line, just like the sample data that's already on that page. I'm not sure how you copy data from a 30 minute chart in Tradestation as I don't use it. Anybody reading this that knows the answer to copy/past data from Trade Station?
1. Do you include the 30 min bracket from 4:00 to 4:30 p.m. or not because the RTH ends at 4:15?
2. Also is the tick size always 0.25 for futures and cash indexes?
3. What is the tick size and decimal place for FOREX(eur/usd,...)?
1. Yes, I typically include the last 15 minutes of trade from 4pm to 4:15pm as the last bracket.
2. No, the tick size is the smallest movement that can take place for the instrument you trade/profile. For YM this would be 1, for ES this would be 0.25 etc.
3. Again this would depend on what the smallest movement you could trade would be. If it's 0.0001 then that's what the tick size would be.
There is one exception to this though. If the tick size is very small then you can round up in multiples of the tick size otherwise you will end up with an extremely elongated profile that is unworkable. Rounding up will usually give you the same type of results that using the exact tick size in this case. Remember you're just trying to get the VAH, VAL, and POC or their developing counterparts....
a) So for the eur/usd pair the tick size would be 0.0001 and 5 decimals? The market profile works on forex as well, right?
b) How do I calculate weekly/monthly levels? Do I put the 30 min brackets from the entire week (13 brackets/day x 5 days) in the calculator?
thanks for the quick replys
b) How do I calculate weekly/monthly levels? Do I put the 30 min brackets from the entire week (13 brackets/day x 5 days) in the calculator?
thanks for the quick replys
Originally posted by clintwer
a) So for the eur/usd pair the tick size would be 0.0001 and 5 decimals? The market profile works on forex as well, right?
b) How do I calculate weekly/monthly levels? Do I put the 30 min brackets from the entire week (13 brackets/day x 5 days) in the calculator?
a) 0.0001 sounds right for EUR/USD but it would have 4 decimal places because there are 4 digits after the decimal point.
b) Correct.
Click image for original size
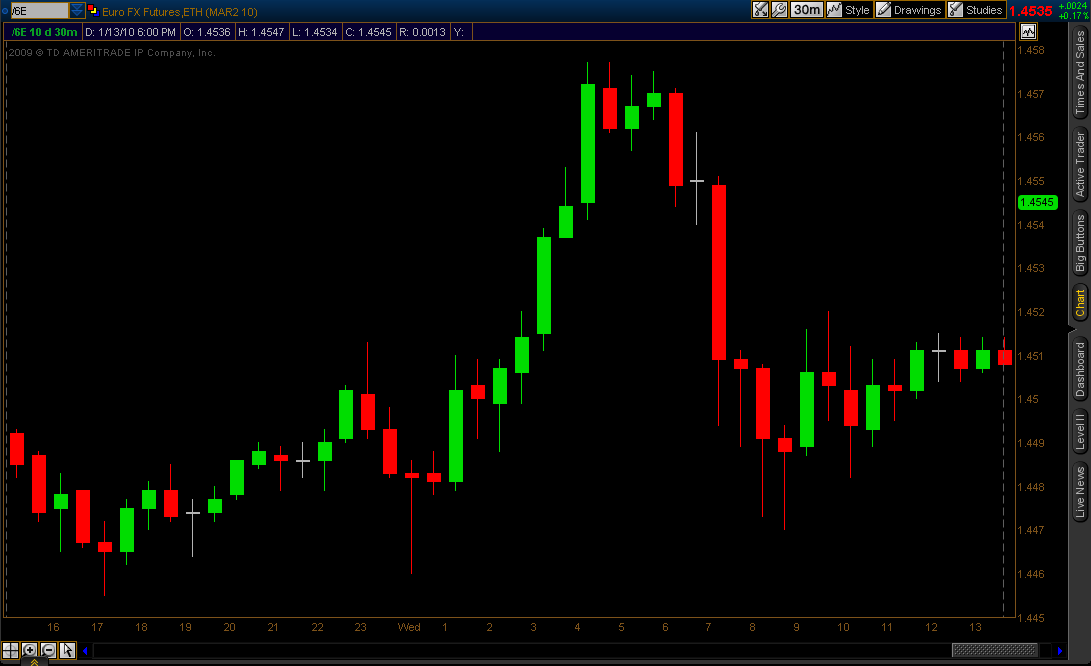
I'm trying to use the market profile calculator for the EURO, but I don't know with wich braket should I start.
Can please some one help me.
The chart is from today 01/13/2010, this is my first time that I post something in a forum, I hope that a upload everything right.
Thanks for your help
Originally posted by Roberto Bnvdz
I'm trying to use the market profile calculator for the EURO, but I don't know with wich braket should I start.
Start when the market "opens." For 24 hour markets this is either when the traditional market in your country used to open or when you see the most morning liquidity in the market. Each bracket is 30 minutes long.
Thanks for the quick replay.
Some traders ignore the last bracket but I believe that most traders include it. I think that you should include it as there is significant day trading closing out that happens in that bracket.
Emini Day Trading /
Daily Notes /
Forecast /
Economic Events /
Search /
Terms and Conditions /
Disclaimer /
Books /
Online Books /
Site Map /
Contact /
Privacy Policy /
Links /
About /
Day Trading Forum /
Investment Calculators /
Pivot Point Calculator /
Market Profile Generator /
Fibonacci Calculator /
Mailing List /
Advertise Here /
Articles /
Financial Terms /
Brokers /
Software /
Holidays /
Stock Split Calendar /
Mortgage Calculator /
Donate
Copyright © 2004-2023, MyPivots. All rights reserved.
Copyright © 2004-2023, MyPivots. All rights reserved.