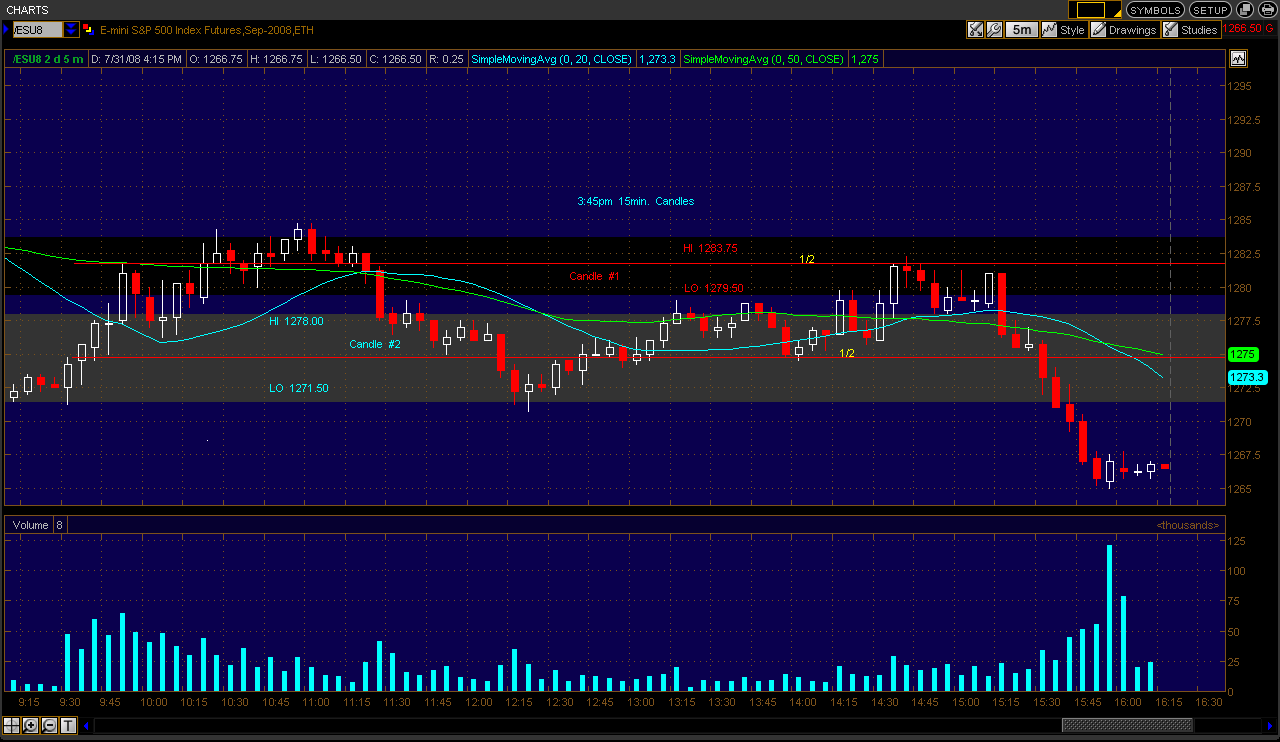
The last 15min. candle of the RTH (3:45ET) I mark this candle and keep a record of prior candles. Today I have yesterday candle
Hi 1283.75 Lo 1279.50 and below that candle I have marked a prior candle Hi 1278.00 Lo 1271.50. I draw a line in the middle of the candle. A check of price action reveal how these areas act; also alot of supp/res can be found here (poc-pivots-ect.) Just my 2cents.
BR
BruceM
Rep: 216,211
Posts: 19,895
cool ..can you upload a chart ? It always helps to see a picture and those reading this thread in the future will have a reference..thanks for sharing the concept..
quote:
Originally posted by redsixspeed
The last 15min. candle of the RTH (3:45ET) I mark this candle and keep a record of prior candles. Today I have yesterday candle
Hi 1283.75 Lo 1279.50 and below that candle I have marked a prior candle Hi 1278.00 Lo 1271.50. I draw a line in the middle of the candle. A check of price action reveal how these areas act; also alot of supp/res can be found here (poc-pivots-ect.) Just my 2cents.
RE
redsixspeed
Rep: 4,111
Posts: 1,711
There is something screwy <<<<<<(this is a tech term); in my platform. Support is working on it now.
SP
SPQR
Rep: 0
Posts: 519
So I says to myself, "That triangle pullback right there looks like a gutter slut lookn' for a fix." What did I do? I bought a piece. Thankfully I used protection.
Lost a tick. Reversed sitting on 10 handles targeting 1237.
Say hi to the bear now kids. "HI, BEAR!." ;)
Lost a tick. Reversed sitting on 10 handles targeting 1237.
Say hi to the bear now kids. "HI, BEAR!." ;)
RE
redsixspeed
Rep: 4,111
Posts: 1,711
I have a 3:45 candle @ hi 1254.50 lo 1251.00 the mean is 1252.75. Now the market will tell me what it thinks.