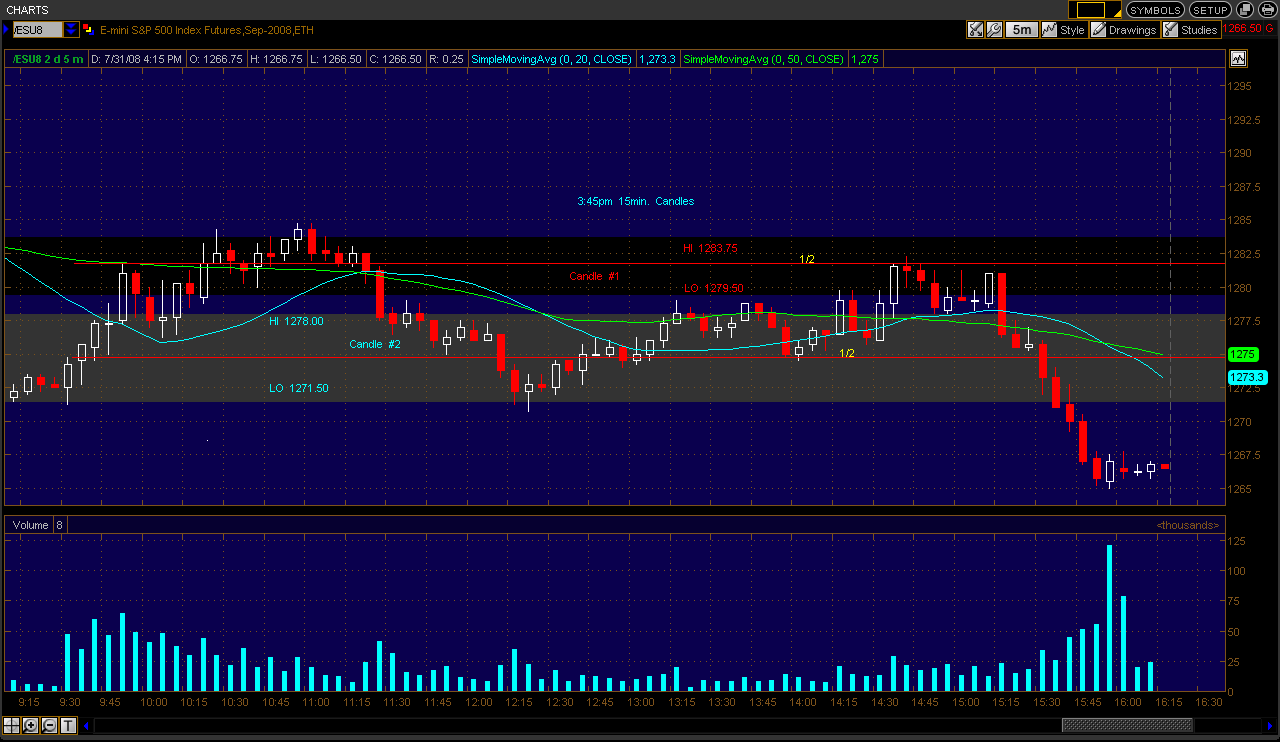
An Area I Watch
The last 15min. candle of the RTH (3:45ET) I mark this candle and keep a record of prior candles. Today I have yesterday candle
Hi 1283.75 Lo 1279.50 and below that candle I have marked a prior candle Hi 1278.00 Lo 1271.50. I draw a line in the middle of the candle. A check of price action reveal how these areas act; also alot of supp/res can be found here (poc-pivots-ect.) Just my 2cents.
Hi 1283.75 Lo 1279.50 and below that candle I have marked a prior candle Hi 1278.00 Lo 1271.50. I draw a line in the middle of the candle. A check of price action reveal how these areas act; also alot of supp/res can be found here (poc-pivots-ect.) Just my 2cents.
Click image for original size
1263 sq .146 confirms the hi of a prior 3:45 candle @ 1262.50 also I have a fib @ 1263
DayTrading; I do not get the option to copy/past rather copy/cut. I'am going to talk to the geeksquad today maby they can help me. Until then if you have an email address I can send the chart and you could publish?
I've sent you an email that you can reply to with a chart attached. Here are a couple of links that might help you with saving and uploading a chart: Screen capture software and Uploading a chart
redsixspeed: Here's the chart you sent me:
Click image for original size
Thanks DT; I have tried the steps in the link you posted. Hope I get it to work next time.
I regret I didn't make clear on the chart above the shaded areas are the 3:45pm 15min. RTH candles I am refering to in the first post of this topic.
Thanks redsixspeed - I've added the chart to your first post as well.
cats,
I am showing that the "J's" never broke open range, I think its a typo the low was 1253.75 on my data.
127175.00 D
127150.00 D
127125.00 D
127100.00 D
127075.00 D
127050.00 D
127025.00 D
127000.00 D
126975.00 D
126950.00 D
126925.00 D
126900.00 D
126875.00 D
126850.00 D
126825.00 D
126800.00 D
126775.00 D
126750.00 D
126725.00 D
126700.00 D
126675.00 D
126650.00 D
126625.00 D
126600.00 D
126575.00 D
126550.00 D
126525.00 D
126500.00 D
126475.00 DQ
126450.00 DQ
126425.00 DQ
126400.00 DQ
126375.00 DQ
126350.00 DHQ
126325.00 DHLQ
126300.00 DEHLQ
126275.00 DEHLPQ
126250.00 DEHLPQ
126225.00 DEHILPQ
126200.00 DEFHIKLPQ
126175.00 DEFGHIKLNPQ
126150.00 DEFGHIKLMNPQ
126125.00 DEFGHIKLMNPQ
126100.00 DEFGHIKLMNPQ
126075.00 DEFGHIKLMNPQ
126050.00 DEFGHIKLMNPQ
126025.00 DEFGHIKLMNPQ
126000.00 DEFGHIKLMNPQ
125975.00 DEFGHIJKLMNPQ
125950.00 DEFGHIJKLMNPQ
125925.00 DEFGHIJKLMNPQ
125900.00 DEFGHIJKLMNPQ
125875.00 DEFGHIJKLMNPQ
125850.00 DEFGIJKMNPQ
125825.00 DEFGIJKMNP
125800.00 DEFGIJKMNP
125775.00 DEFGIJKMNP
125750.00 EFGIJKMNP
125725.00 EFGJKMNP
125700.00 EFGJKMNP
125675.00 EFJKMN
125650.00 EFJKMN
125625.00 EFJKMN
125600.00 EFJKMN
125575.00 EFJKM
125550.00 EJK
125525.00 EJK
125500.00 EJK
125475.00 EJK
125450.00 EJK
125425.00 EJK
125400.00 EJ
125375.00 EJ
125350.00 E
125325.00 E
125300.00 E
My data matches yours Joe.....we have the famous "b" pattern which for me
implies lower trading if we open higher to fill in the 'b'. Many times these patterns seem to imply that buyers are stepping in so if we trade down below the "b" buldge or start filling it in then we may get a nice rally
implies lower trading if we open higher to fill in the 'b'. Many times these patterns seem to imply that buyers are stepping in so if we trade down below the "b" buldge or start filling it in then we may get a nice rally
Hey Bruce; No problem with posting trades here. I lost connection for a period of time. I have read Crabel system but haven't studied it enough to use it. MP is great!!
Emini Day Trading /
Daily Notes /
Forecast /
Economic Events /
Search /
Terms and Conditions /
Disclaimer /
Books /
Online Books /
Site Map /
Contact /
Privacy Policy /
Links /
About /
Day Trading Forum /
Investment Calculators /
Pivot Point Calculator /
Market Profile Generator /
Fibonacci Calculator /
Mailing List /
Advertise Here /
Articles /
Financial Terms /
Brokers /
Software /
Holidays /
Stock Split Calendar /
Mortgage Calculator /
Donate
Copyright © 2004-2023, MyPivots. All rights reserved.
Copyright © 2004-2023, MyPivots. All rights reserved.