Square of nine's
871
886
901
916
931
946
961
977*
993
1009*
1025
1041
1057
1089
1106
1123*
1140
1157
1174
1191
1208
1225
1243
1261
1279*
1297*
1315
1333
1351
1369
1388
1407
1426
1445
*=these carry more weight since they are also primes.
886
901
916
931
946
961
977*
993
1009*
1025
1041
1057
1089
1106
1123*
1140
1157
1174
1191
1208
1225
1243
1261
1279*
1297*
1315
1333
1351
1369
1388
1407
1426
1445
*=these carry more weight since they are also primes.
Sq of nine is calculated like so....
A full rotation around the square is 2.00. support and resistance comes in at .25, .5. 75 ect ect....
If you were to take a sq of nine S and R number say....1261 the next area of S and R is 1279.
Take the sq root of 1261, add/subtract .25 and x the number by itself.
A full rotation around the square is 2.00. support and resistance comes in at .25, .5. 75 ect ect....
If you were to take a sq of nine S and R number say....1261 the next area of S and R is 1279.
Take the sq root of 1261, add/subtract .25 and x the number by itself.
Joe, I think I understand how you get the next price higher (square of price, add .25 and multiply by itself) but how do you get a price lower? Today in the ES was a perfect example (unless it was just coincidence?). About 60 minutes before close, I used the above process with the low of day in ES and it calculated the high to 1045.50 which was a half point off the eventual high. Was that done correctly? Also, how would I do the opposite? How does one take a high price and calculate it to a possible low?
If I am using this correctly, it really is fascinating. Can you or anyone else recommend any good links on this or good books? Thanks in advance.
If I am using this correctly, it really is fascinating. Can you or anyone else recommend any good links on this or good books? Thanks in advance.
You simply subtract to get the lower resistance number, .146 also works well in the ES intra day. And no it was no coincidence, I have been doing this since 2004.
Joe,
After taking the square of the price, the next step is to add or subtract. Is that number always .25 ? So far in all the examples it seems to be the number always used (rather then .50 or .75)?
Can u explain what you meant by using the .146 ?
Can you recommend any good books or sties on this subject?
Thank you very much for your help. I find this fascinating.
On a daily chart you can also use a 45 degree square out...works wonders. There are only 2 bars you need to know to determine where the market is going and the high or low from the open. Yeah my Coffee and Tea numbers.
Time is part of a geometry. If you want to know pressure ( TIME ) subscribe to Ted Phillips for ES dailies. He is good with his time, but his main/pressure times are great...u just have to know up or down. I DO NOT subscribe...but did in 2007. Pressure is all you need to make great money.
7 is a wonderful number and should bring a reversal in the indices...7 months ( for you wizards...march to oct.)..in October 2009 probably on October 22. ES should be up to 1143 by then. Watch 1126.25!!!! You esteemed traders can calculate the rest of the indices.
Tip for you esteemed traders. Use the previous weeks 50% range...above up below down. This alone is worth more than all you have paid from BS sources and wasting your money on books.
50% is all you need if you know how to use it. Also on the 15 minute ( this is my favourite ) and hourly chart...look for WW. Email me if you want to know what a WW is.
Yes the post is alcohol induced...Johnnie Walker Green label. 3rd Scotch...but I enjoy my drink like a reading a true source 1897 novel. Nonetheless....if you listen to my prescient points you will never fail. Or buy some more books and take some more courses and listen to more nonsense.
Yen low in Jan 2010..may go sideways after this for some months and a wonderful high in 2012. Sugar down to $14/15 by July 2010. High should be in Nov 2009..but that low number is coming.....by July 2010. Coffee high in 2011....copper, beans, meal, wheat, corn, gold, silver....so many $$$$...I need another drink.
US index low in 2012...41 !!!! CAD 1.27-1.59 by 2012-2014.
Where is the ES, YM going and where will it be in 2014/2015....I know and that I'm not telling.
If you really want to know time look at the bible New and Old testament. It's all there. Read Daniel...if will tell you a lot. Fibs nubers are good but Daniel numbers are even better. Gann took all from here and used astrology as well.
Music will also tell you alot about waves and highs and lows. "Song of the Wind."
Good luck
Hello Pips,
i was going to email you about the WW but the system wont let me due to my low number of posts... that makes me unworthy i guess.... lol
anyways would you please let me know what it means?
greetings
i was going to email you about the WW but the system wont let me due to my low number of posts... that makes me unworthy i guess.... lol
anyways would you please let me know what it means?
greetings
Toulouse-Lautrec,
WW is Wolfe Wave. check the site. You should get an understanding. This is much better than Elliot Waves. I look for it on a 15 minute and 1 hour chart on ES. You can find them on smaller time frames but I do not trade smaller time frames.
KoolBlue is good and so is Charter Joe for daytrading the ES. They know a lot of stuff.I follow very few truths.
Just remember everything is based on time. Time is in everyones life....see your ups and downs...its part of time/karma/universal law.
Good luck
Toulouse-Lautrec,
Today on a 15 minute chart was a beautiful WW. Set up beautifully. The 5 point was at 1058.50 on the 7.15 bar. From there it went all the way up to 1065.25. 6.75 points YOU knew was coming. 1-2-3-4 like a musical progression.
It will take you TIME to figure this out and lots of time, but after spending 12-14 hours days for 4-5 years..it becomes very easy. You can see it. You should see a lot on any chart by then. If not you are not passionate about it... do something else.
Good luck.
pips, thanks for the explanation.
pips,
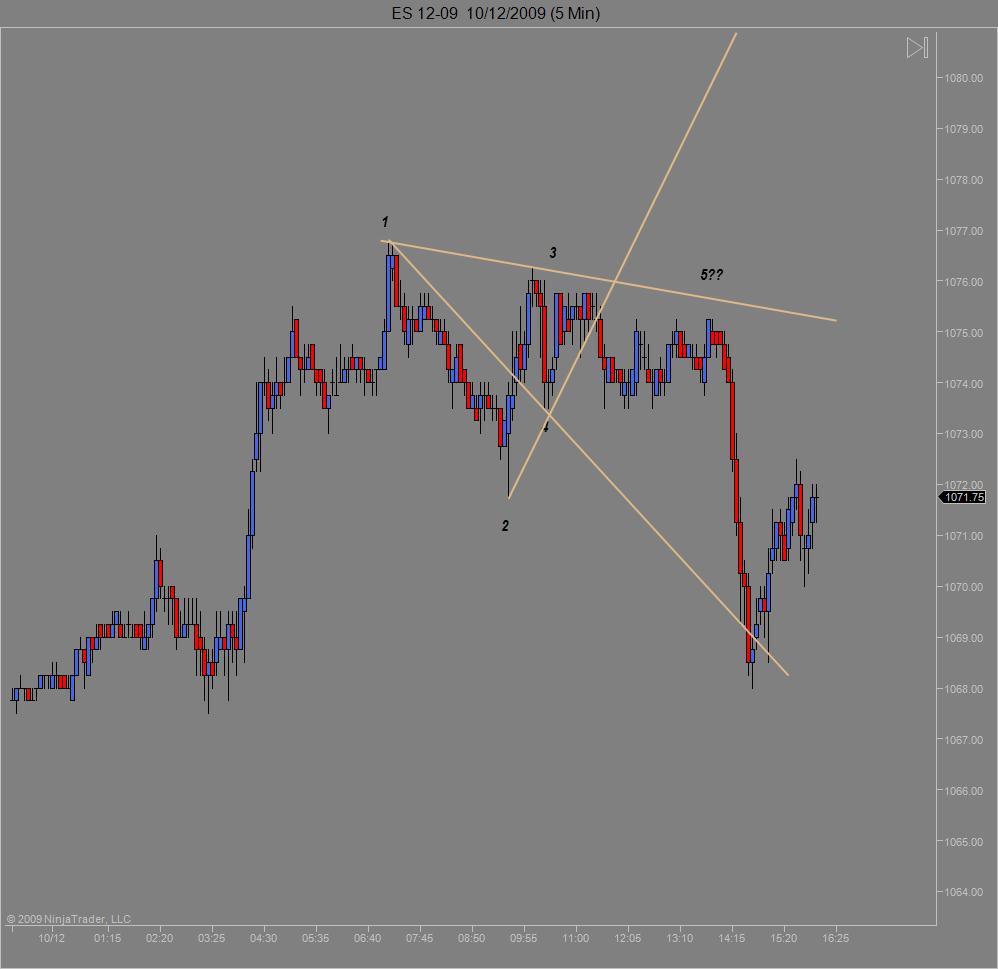
this is what i came up with today. thanks again for making me aware of this very nice pattern.
comments would be appreciated, as i´m not sure i did it 100% right (does pt 5 have to touch? ... i guess they dont really have to be perfect, have they?)
on a sidenote, the correction from the bottom is equidistant to 2-3.
Click image for original size
I haven't traded bonds yet, I started using Sierra charts Aug 1st & it has a sq of 9 study, I remembered this thread & put the sq of 9 study on GC & ZB just to see, the #s are like magnets! The settings that seem to work best are 22.5 degrees & 45 degrees in that order.
Emini Day Trading /
Daily Notes /
Forecast /
Economic Events /
Search /
Terms and Conditions /
Disclaimer /
Books /
Online Books /
Site Map /
Contact /
Privacy Policy /
Links /
About /
Day Trading Forum /
Investment Calculators /
Pivot Point Calculator /
Market Profile Generator /
Fibonacci Calculator /
Mailing List /
Advertise Here /
Articles /
Financial Terms /
Brokers /
Software /
Holidays /
Stock Split Calendar /
Mortgage Calculator /
Donate
Copyright © 2004-2023, MyPivots. All rights reserved.
Copyright © 2004-2023, MyPivots. All rights reserved.