ES 1-07-09
DOWN ONE O/N THE DAY , SELLING 922.25...WATCHING
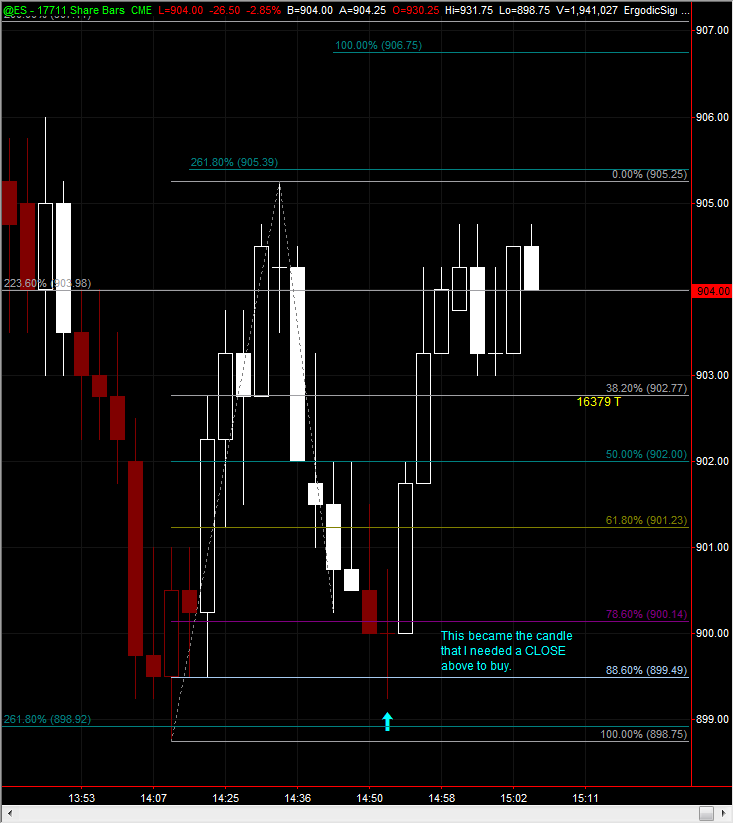
As it turns out, I ended up with a better entry, but it was stupid. Always wait for your confirmation! And lets give a big thanks to .886 as he came through like a champ today on severals trades.
Click image for original size
quote:
Originally posted by vast524
I am wonder where I should read about the rules you are using now to trade with please.
Seems that you are using several different charts. ie. Min, tick...
I sort of get it but need to try and study the fine print.
Thanks
I would start at the beginning by reading Koolblue's method which he was generous enough to write up and archive for us at the following links:
Price: http://www.mypivots.com/articles/articles.aspx?artnum=54
Time: http://www.mypivots.com/articles/articles.aspx?artnum=55
Putting it together: http://www.mypivots.com/articles/articles.aspx?artnum=53
Next, you will want to read VO's thoughts in the following threads:
http://www.mypivots.com/forum/topic.asp?TOPIC_ID=3487
http://www.mypivots.com/forum/topic.asp?TOPIC_ID=3717
Also, I suggest you study each chart in the Chart Forum, as there is a treasure of work being captured here:
http://www.mypivots.com/forum/forum.asp?FORUM_ID=4
It is important to understand we are each individual traders coming from very different training and backgrounds. We are also using different charting packages. One difference you will notice immediately is KB is using minute charts, VO is primarily using Tick charts, and I am using Volume charts. Each has its strengths and weaknesses, thus all I can suggest is you go with what works best for you.
For the sake of simplicity, I would start with two or at most three chart time frames. For example, KB primarily uses the 15, 5 and 1 minute charts, and will incorporate the 60 minute chart ( as we saw today). VO uses the 610 Tick chart and some longer term charts. Perhaps he can add some thoughts or suggestions as well.
I use a 10,000 volume chart and a 2,100 volume chart for this work, but when necessary will expand out to the 30 minute chart to get a big picture view of a larger pattern. The 2,100 V is faster version of the 1 minute chart. The 10,000 V is a blend of the 1 and 5 minute charts and is a reasonable match to VO's 610T chart.
I know you're all probably tired of hearing this, but thank you for your time and patience. PT - that's a pretty decent post, )(complete with valid links and all!) in response to a question you've all fielded many times. Once you start practicing this technique, it does become very easy (probably), but getting past the discretionary issues (which ABC pattern? is one more valid than another? what type of confirmation? which fib numbers are most reliable, etc.) presents the biggest obstacle and you guys handle them with grace and aplomb (and maybe a little VO & water?). Thanks again.
Pt, once again thank you. You are a great asset to the forum. You have always taken time to answer my questions in full and that is very much appreciated.
Thank you for the links and explaining the chart times.
All the best with your trading.
Thanks also to Kool and VO and the others that share there thoughts.
Regards
Thank you for the links and explaining the chart times.
All the best with your trading.
Thanks also to Kool and VO and the others that share there thoughts.
Regards
Long ES 906 into the A.M. SL below todays low. It needed a pull back and got a good one. I hope this up run will continue but just looking for a bounce. it did take out this weeks IB soooo not looking for much. Just thinking out loud.
Targeting 1/2 916 and rest at 923.
Emini Day Trading /
Daily Notes /
Forecast /
Economic Events /
Search /
Terms and Conditions /
Disclaimer /
Books /
Online Books /
Site Map /
Contact /
Privacy Policy /
Links /
About /
Day Trading Forum /
Investment Calculators /
Pivot Point Calculator /
Market Profile Generator /
Fibonacci Calculator /
Mailing List /
Advertise Here /
Articles /
Financial Terms /
Brokers /
Software /
Holidays /
Stock Split Calendar /
Mortgage Calculator /
Donate
Copyright © 2004-2023, MyPivots. All rights reserved.
Copyright © 2004-2023, MyPivots. All rights reserved.