Questions on methods!
Because we keep getting the same questions,perhaps P.T.'s post here would be of value to newcomers!
I would start at the beginning by reading Koolblue's method which he was generous enough to write up and archive for us in the following threads:
Kool's Tools for Time
Kool's Tools for Price
Putting it together
Next, you will want to read VO's ABC pattern in the following threads:
ABC part 1
ABC part 2
Also, I suggest you study each chart in the Chart Forum, where there is a treasure of work and examples archived.
It is important to understand we are each individual traders coming from very different training and backgrounds. We are also using different charting packages. One difference you will notice immediately is Kool is using minute charts, VO is primarily using Tick charts, and I am using Volume charts. Each has its strengths and weaknesses, thus all I can suggest is you go with what works best for you.
For the sake of simplicity, I would start with two or at most three chart time frames. For example, Kool primarily uses the 15, 5 and 1 minute charts, and will incorporate the 60 minute chart ( as we saw today). VO uses the 610 Tick chart and some longer term charts.
quote:
Originally posted by vast524
I wonder where I should read about the rules you are using now to trade with please. Seems that you are using several different charts. ie. Min, tick... I sort of get it but need to try and study the fine print. Thanks
I would start at the beginning by reading Koolblue's method which he was generous enough to write up and archive for us in the following threads:
Kool's Tools for Time
Kool's Tools for Price
Putting it together
Next, you will want to read VO's ABC pattern in the following threads:
ABC part 1
ABC part 2
Also, I suggest you study each chart in the Chart Forum, where there is a treasure of work and examples archived.
It is important to understand we are each individual traders coming from very different training and backgrounds. We are also using different charting packages. One difference you will notice immediately is Kool is using minute charts, VO is primarily using Tick charts, and I am using Volume charts. Each has its strengths and weaknesses, thus all I can suggest is you go with what works best for you.
For the sake of simplicity, I would start with two or at most three chart time frames. For example, Kool primarily uses the 15, 5 and 1 minute charts, and will incorporate the 60 minute chart ( as we saw today). VO uses the 610 Tick chart and some longer term charts.
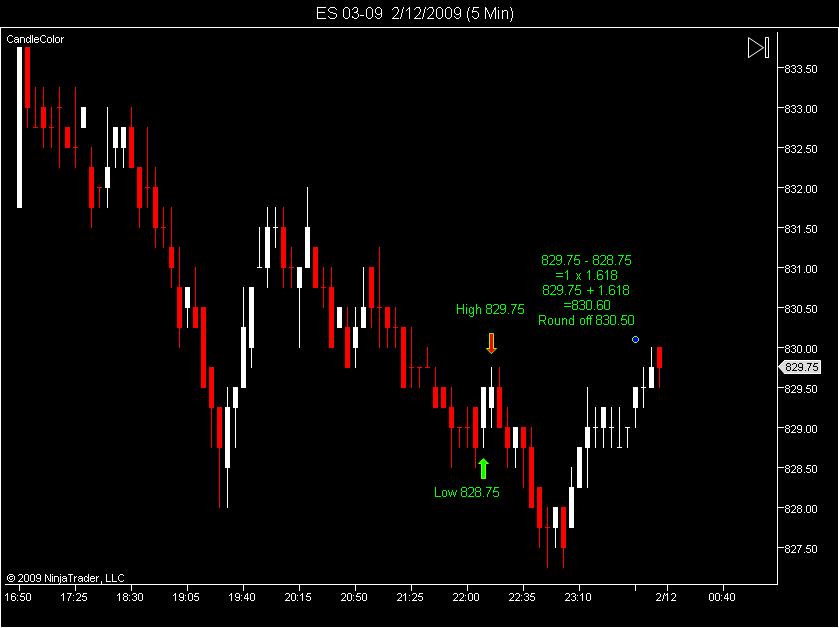
Another one.
830.50 is not hit yet as of this posting.
830.50 is not hit yet as of this posting.
Click image for original size
quote:INTERESTINGL...L.A., but if you use my method 833.75 -831.50=2.25 and 2.25x2.618=5.89 so 833.75-5.89=827.75 and looks to be a direct hit! i think it may be more accurate
Originally posted by lordalfa
Hi Kool.
Please comment on my application of your method.
BR,
LordAlfa
Click image for original size

****! My math failed. My calculation is wrong.
Your calculation is correct.
Your calculation is correct.
So using Kool's Tools it looks like we are in the 5th wave down from the Jan 6th high and the 2.618 projection is to the ES 560. Am I correct?
quote:
Originally posted by smithgar
So using Kool's Tools it looks like we are in the 5th wave down from the Jan 6th high and the 2.618 projection is to the ES 560. Am I correct?
if you go to the weekend chart summary there are several charts in there with wave counts. In specific, there is a weekly chart showing the count with the projection down, which is showing the wave equality with the 1st.
Kool, When do you 1.618 and 2.618?
i always use 2.618,L.A. and add or subtract to the start of the upmove or down move
The examples from this post use 1.618
http://www.mypivots.com/forum/topic.asp?TOPIC_ID=3877
So what is the difference? I am even more confused now.
http://www.mypivots.com/forum/topic.asp?TOPIC_ID=3877
So what is the difference? I am even more confused now.
quote:
Originally posted by wirechild
The examples from this post use 1.618
http://www.mypivots.com/forum/topic.asp?TOPIC_ID=3877
So what is the difference? I am even more confused now.
wirechild if you use 2.618 then you need to use it from the start of the move (which is what koolio does). If you use 1.618 you would use it from the end of the move. Do both and you will find that they give you the same number.
Emini Day Trading /
Daily Notes /
Forecast /
Economic Events /
Search /
Terms and Conditions /
Disclaimer /
Books /
Online Books /
Site Map /
Contact /
Privacy Policy /
Links /
About /
Day Trading Forum /
Investment Calculators /
Pivot Point Calculator /
Market Profile Generator /
Fibonacci Calculator /
Mailing List /
Advertise Here /
Articles /
Financial Terms /
Brokers /
Software /
Holidays /
Stock Split Calendar /
Mortgage Calculator /
Donate
Copyright © 2004-2023, MyPivots. All rights reserved.
Copyright © 2004-2023, MyPivots. All rights reserved.