ES short term trading 4-23-10
Good morning. still looking for that E wave to 1196 (or even lower3-4 handles!). Heck, i still want to see slightly higher to be sure D is complete. I also have 1212.25 as a possibility on the upside if we just continue higher. (wave 4 could also have completed at 1186.25 making a flat.). Monday the 26th looms just ahead. It certainly looks like Thurs. gave us a great low for the late Friday run up into bullish Monday. heres a short term look...
Click image for original size
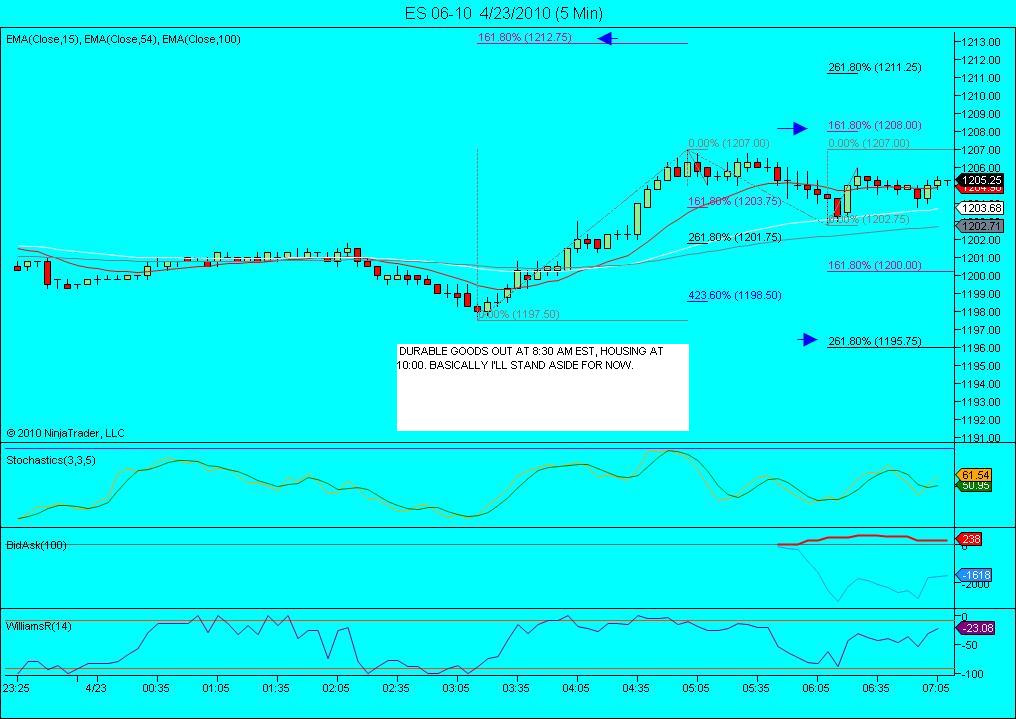
firsttarget is 06.25...that is air pocket /LV
If 1206.75 holds we will have overnight short positions for monday
filled at 06.25...trying to hold last 3 with stop at 08.75...these volume zones are buy opportunities for some...not me...next target is that 03.50 if lucky
one more off at 04.50... open print ...last two will stop at 07.50
air pocket is filled but may be trouble as no time spent inthere...YET!
Click image for original size
Admin edit: Replaced word doc with contents of doc which was this chart.
This is why BruceM rocks! Constant selfless giving.
Originally posted by BruceM
...Most imprtant to me is that you know how to spot these without me if you find them helpful...
09:09:44 SELL_LIMIT 1208.75
09:34:04 BUY_LIMIT 1204.75
09:34:04 BUY_LIMIT 1204.75
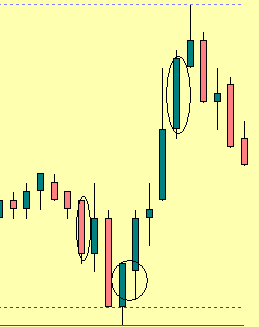
I have other questions for later but can someone post this candle pattern...I don't "do" candles so I'm curious
Originally posted by ak1
The 10:05 is the golden short candle
I have posted the chart Bruce, see above at 10:37
Originally posted by redsixspeed
using the move from yesterday I have a measured move to 1218.25
this is my highest projection
====================================================================
Yesterday in the above quote would be refering to Thursday.
The projection of 1218.25 is still on the radar as we have not had a pull back yet that would cancel that projection..imo
Emini Day Trading /
Daily Notes /
Forecast /
Economic Events /
Search /
Terms and Conditions /
Disclaimer /
Books /
Online Books /
Site Map /
Contact /
Privacy Policy /
Links /
About /
Day Trading Forum /
Investment Calculators /
Pivot Point Calculator /
Market Profile Generator /
Fibonacci Calculator /
Mailing List /
Advertise Here /
Articles /
Financial Terms /
Brokers /
Software /
Holidays /
Stock Split Calendar /
Mortgage Calculator /
Donate
Copyright © 2004-2023, MyPivots. All rights reserved.
Copyright © 2004-2023, MyPivots. All rights reserved.