ES short term trading 6-2-10
Lots matching up again
86 - 87.5 rat and POC
81.25 Rat and Va low
75 - 77 Rat, weekly PV and current O/N high, breakdown point from YD aftrenoon *******
67 - 68 rat and current O/N low - YD low****
the MP players wll be watching to see if price is brought back uo into value today or if new value will be established lower from that late day spike. Usually after a consolidation and run out in the afternoon that closes on it's lows we get follow thorugh...so many will be trying to get short up in the 76 - 77 area in the O/N and target lows below YD's low
We know we will probably print at least two ratchets so we can watch which one prints first to try and establish which one will print second. This is being done in attempt to hold runner contracts longer with a good signal. My bias is short untill we trade below YD's lows, then we need to be thinking about the possible GAP AND RAT down at the 61 - 62 area. Below there is 56 area and another RAT. That may be an agressive goal. Goodluck today
Air at 1095.25 should get us a pt
you will get it Piker...all the stuff I use is fairly simple...like anything it takes practice....you WILL get it....have you been to the price overlap thread? I think I explained it there with some examples...the "air" concept
Originally posted by BruceM
How can u see the burst of short covering ? I'm lame with that kind of stuff...always thought if I could see that stuff I could own the world...LOL...But seriously Phileo what were you looking at?Originally posted by phileo
Originally posted by BruceM
they filled in the singles and I knew that was agressive..I still like the idea though of it running higher..with that gap and crappy high as magnets....we just may be early...will try one more time//perhaps th e vwappers down at 79 will help us
yeah, it does look like we were early. saw the burst of short covering, and now the EMA's are starting to point up again.
good on you for the 2nd attempt!
Hi Bruce,
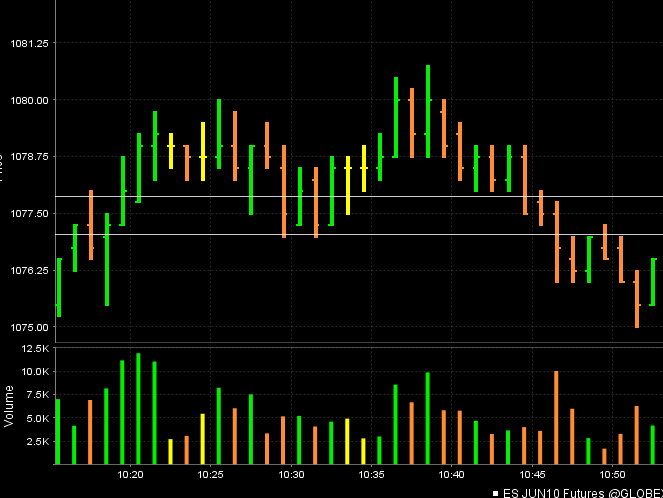
Ok, short covering may have been the wrong term to describe it. But here's what I was looking at:
Click image for original size
20/20 hindsight, but There was a lot of arguments for a reversal at 1081:
- rising VWAP
- previous swing low not violated
- O/N hi and prior support lvl not even reached.
- 1081 was the starting point for yesterday's selloff.
Ok, so maybe not burst of short covering, but certainly a burst of buying. This one in particular was significant because of the slope of the rise was even greater than the slope of the rise at 755A (PST).
So, I am looking at the slope and magnitude of the rise to tell me how strong the buyers were. In this case, we not only exceeded previous swing hi (ie. prior intraday resistance), but also saw follow thru. I'd say this was the "all clear" signal for at least tomorrow, and possibly even friday, depending on the NFP report.
Note also that we are also setting up nicely for an MATD day tomorrow.
Originally posted by BruceM
you will get it Piker...all the stuff I use is fairly simple...like anything it takes practice....you WILL get it....have you been to the price overlap thread? I think I explained it there with some examples...the "air" concept
Yes, I just started reviewing the "price bar overlap" and "your favorite entry bars" threads.
Also, one more thing. Could you describe what you mean by a "crappy high"? Is it a higher high that doesn't surpass the previous high by a wide enough margin?
thanks Phileo ..I appreciate the detailed response.....I like the idea of looking for sells if we gap higher tomorrow in RTh....which goes well with the morning after idea...
I thought maybe you were looking at the "footprint" or the DOM or T&S...one of the many things I just can't get a grip on
I thought maybe you were looking at the "footprint" or the DOM or T&S...one of the many things I just can't get a grip on
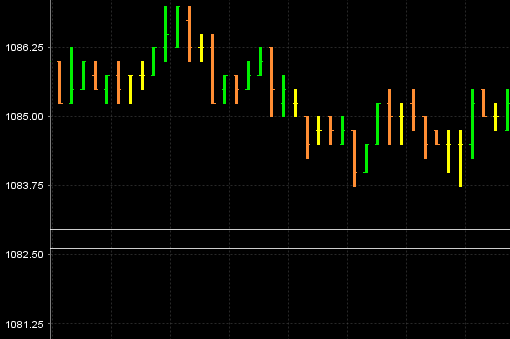
Piker ..look at this one minute high above 1086....it is a triple top and it doesn't show anyone in a real rush to enter shorts...the 5 minute showed a double top...while far from perfect, we really want to see someone rush ito the market because they feel that a short opportunity won't last long so they enter quickly and move price fast...usually leaving "tails" on even the one minute time frame
the crappy highs and lows get test often but don't use it as a stand alone target...u really need other reasons
the crappy highs and lows get test often but don't use it as a stand alone target...u really need other reasons
Click image for original size
Originally posted by BruceM
Piker ..look at this one minute high above 1086....it is a triple top and it doesn't show anyone in a real rush to enter shorts...the 5 minute showed a double top...while far from perfect, we really want to see someone rush ito the market because they feel that a short opportunity won't last long so they enter quickly and move price fast...usually leaving "tails" on even the one minute time frame
the crappy highs and lows get test often but don't use it as a stand alone target...u really need other reasons
Thanks for the explanation Bruce.
this was a good high that dropped 5 points.....it also got tested but I'm really trying to show you the structure differences....compare what happens on your 5 minute chart when you see a Good and bad high..
You want to see a rush to exit/ trade which will show excess at highs and low points....double tops and bottoms doesn't show anybody being in a rush to get out or into trades......It's lazy and that is why double tops and triples don't hold too often.....too much time has been spent at those prices so many have seen the opportunity...if too many see it in the market then there is a good chance they are wrong and will get taken out of the market....not a perfect concept but given the right circumstance will help you catch a longer trade or have a good target..naturally good and bad highs and lows get traded thorugh...some are more obvious as targets
You want to see a rush to exit/ trade which will show excess at highs and low points....double tops and bottoms doesn't show anybody being in a rush to get out or into trades......It's lazy and that is why double tops and triples don't hold too often.....too much time has been spent at those prices so many have seen the opportunity...if too many see it in the market then there is a good chance they are wrong and will get taken out of the market....not a perfect concept but given the right circumstance will help you catch a longer trade or have a good target..naturally good and bad highs and lows get traded thorugh...some are more obvious as targets
Click image for original size
Click image for original size

Emini Day Trading /
Daily Notes /
Forecast /
Economic Events /
Search /
Terms and Conditions /
Disclaimer /
Books /
Online Books /
Site Map /
Contact /
Privacy Policy /
Links /
About /
Day Trading Forum /
Investment Calculators /
Pivot Point Calculator /
Market Profile Generator /
Fibonacci Calculator /
Mailing List /
Advertise Here /
Articles /
Financial Terms /
Brokers /
Software /
Holidays /
Stock Split Calendar /
Mortgage Calculator /
Donate
Copyright © 2004-2023, MyPivots. All rights reserved.
Copyright © 2004-2023, MyPivots. All rights reserved.