ES short term trading 6-04
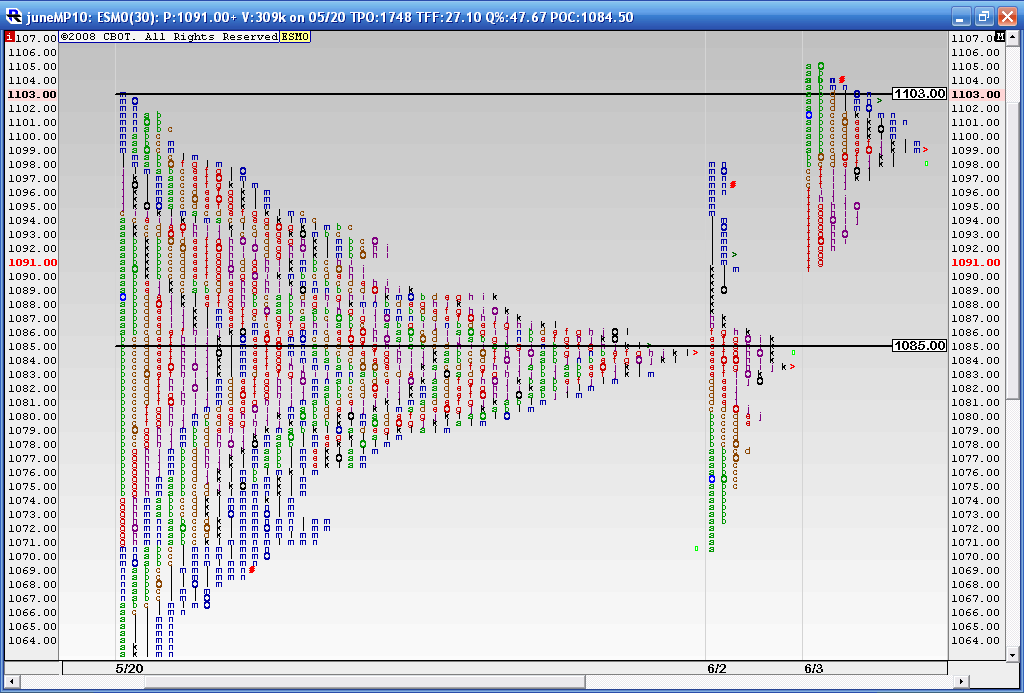
Here is a composite profile that includes all this consolidation from 5-20 including Tuesdays Trade. You may remember that Tuesday closed down at 1068 which is far below that huge volume node at 1085. This also shows what happened on Wednesday and today. Wednesday closed back above the 1085 and then today they established Value higher than Wednesday.
If I was writing an MP book then this would be "Textbook" with that high node at 1085 and then closing and building value higher today.
With any luck we will have a nice rally from here. The simplistic view is that if this rally fails then that 1085 becomes the attractor price and back down we go.
If I was writing an MP book then this would be "Textbook" with that high node at 1085 and then closing and building value higher today.
With any luck we will have a nice rally from here. The simplistic view is that if this rally fails then that 1085 becomes the attractor price and back down we go.
Click image for original size
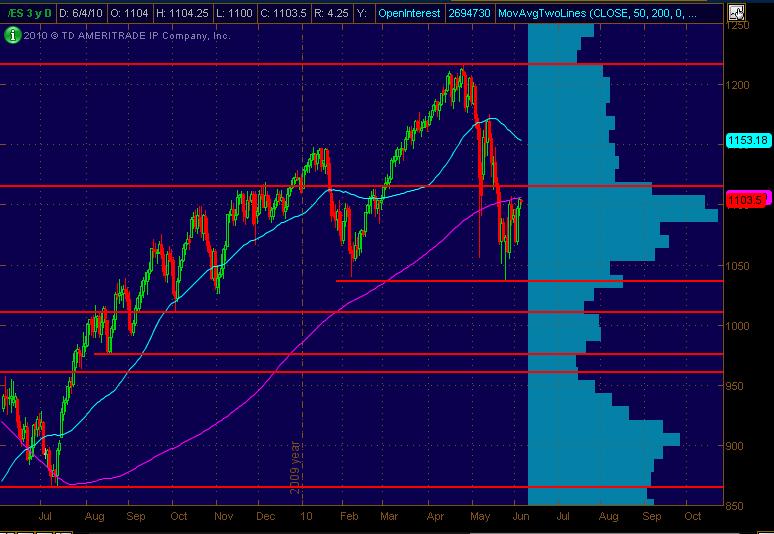
I'm following up with what I've got and am seeing. The initial Daily chart is just for a reminder of the big pic of the ES continual contract. Red lines are major S/R price levels with the 50 and 200 sma's.
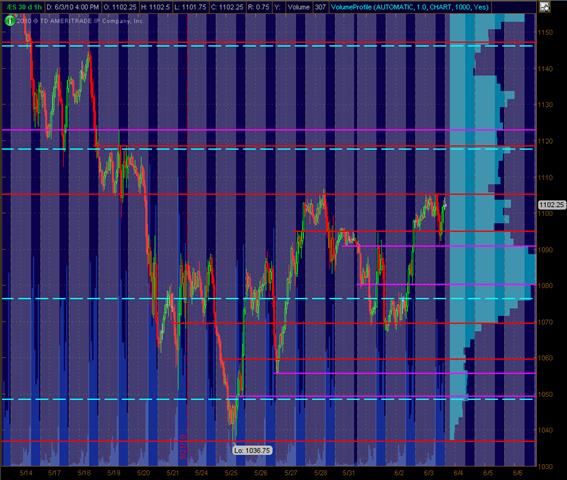
And then the 30min chart with Red lines as signif price action S/R levels and Magenta as semi-significant. The Cyan dashed lines are the Wkly Pivot lines.
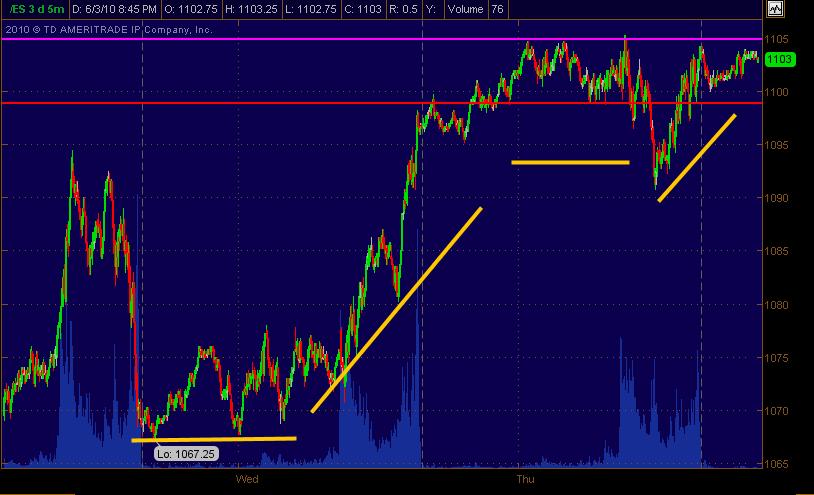
And finally the LOOK and FEEL of 5min price action with Yellow lines showing strength that to me tastes like pent up buying and a move long out of this 1098-1105 range (with a quick retracing pullback down to 1190 and fast push back up into the range).
Click image for original size
And then the 30min chart with Red lines as signif price action S/R levels and Magenta as semi-significant. The Cyan dashed lines are the Wkly Pivot lines.
Click image for original size
And finally the LOOK and FEEL of 5min price action with Yellow lines showing strength that to me tastes like pent up buying and a move long out of this 1098-1105 range (with a quick retracing pullback down to 1190 and fast push back up into the range).
Click image for original size
My two biggest concerns up here are the narrow range of today and the low volume...so these are big concerns..we need to see some better volume tomorrow or else this is going back down...
I hope I'm wrong....
I hope I'm wrong....
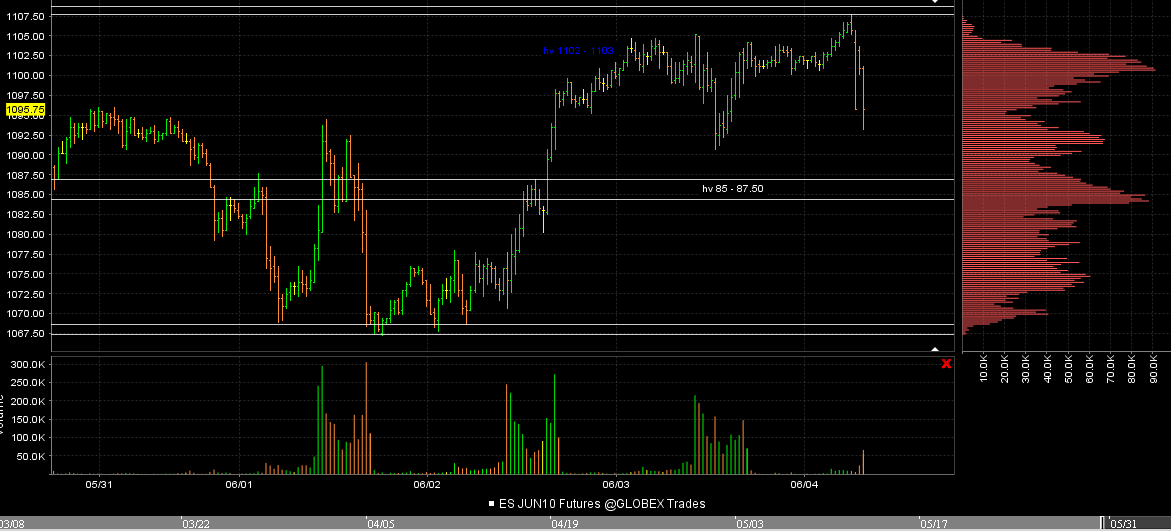
here is another interesting view. We have that Hv zone in the middle and then we span 20 points above and below that at the extremes........all numbers happen to be rat levels too...so will they fill in 85 - 1107 or will they break it out ? Sure wish I knew...report in an hour will change things up a bit...hopefully they now sold it off in O/N just so they can buy at lower prices
For me that 85 - 87.50 is top support to watch..we don't want the market to get below and spend time below there..
Working a small long at 95.50 here in O/N to try and target the 1100 area....99 will work for me...air pocket up there....watch out if they keep selling now...
Click image for original size
For me that 85 - 87.50 is top support to watch..we don't want the market to get below and spend time below there..
Working a small long at 95.50 here in O/N to try and target the 1100 area....99 will work for me...air pocket up there....watch out if they keep selling now...
How many times are we seeing 93.75 shows it face...current O/N low and RAT...obvious failure will go down to 87.50
flat 94.75...too early for me..
one more try from 92.25...
looks to me they might be rejecting 93.75 ratchet and going for 87.5...
IMHO, this market is a coiled spring ready to expand.
I always look at mypivots daily numbers to see whether the previous day was a wide range day or a narrow range day. I look at the cash SPX because I am more concerned with how the big money is treating prices.
select
Daily numbers
Cash S&P
and then you can find the narrowest in X days or the widest in X days at the bottom of the page underneath Crabel Price Patterns table.
yesterday was the smallest range in 25 trade days. Significant. Price is a coiled spring right now.
Immediate support is swing low from yesterday in the 91 area.
right now it looks like there is a potential to test the 50% retracemnt of this week which is also a rat at exactly 87.50.
I can't tell you which direction a breakout will occur and I hesitate to lean too heavily on historical data for this particular employment report Friday, but one thing I will point out. The Low from RTH on Wednesday was 70.75... 70.75 was exactly the 50% retracement level of the previous week, for the market to have found buyers there is important (a positive IMHO, unless 70.75 is broken, ,more immediately unless 87.50 is broken).
If the 87.50 (50% of this week) acts like support, a move up to 1110 can easily unfold. if 87.50 breaks welllllllllll... maybe 70.75 awaits a visit.
but right now, I think the market got a little ahead of itself by testing and taking out 1106.75 (previous week's 24 hour High), The O/N move to take out 1106.75 by just a point was a classic Wyckoff Up Thrust, where established resistance is taken out by a small degree and the move unlocks an immediate reversal.
the current weakness is being helped by headlines from euroland...(fueled by hedge fund and bank default concerns Hungary bank default, Soc Generale potential currency losses)) this pre employment report weakness might only prove to have been an accumulation campaign).
should be interesting nonfarms payroll number.
well i was wrong.
have to say though when i made that call it looked like they couldnt break 93.75 and were trending lower still
have to say though when i made that call it looked like they couldnt break 93.75 and were trending lower still
flat 94.75..too close to reports and light trade for me
Oh great..u'll enjoy that...Have you read Daltons Book?
Emini Day Trading /
Daily Notes /
Forecast /
Economic Events /
Search /
Terms and Conditions /
Disclaimer /
Books /
Online Books /
Site Map /
Contact /
Privacy Policy /
Links /
About /
Day Trading Forum /
Investment Calculators /
Pivot Point Calculator /
Market Profile Generator /
Fibonacci Calculator /
Mailing List /
Advertise Here /
Articles /
Financial Terms /
Brokers /
Software /
Holidays /
Stock Split Calendar /
Mortgage Calculator /
Donate
Copyright © 2004-2023, MyPivots. All rights reserved.
Copyright © 2004-2023, MyPivots. All rights reserved.