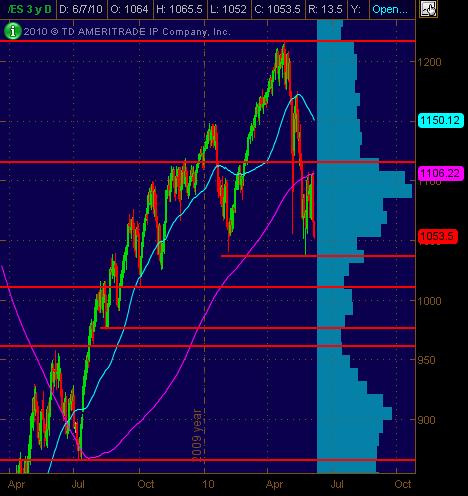
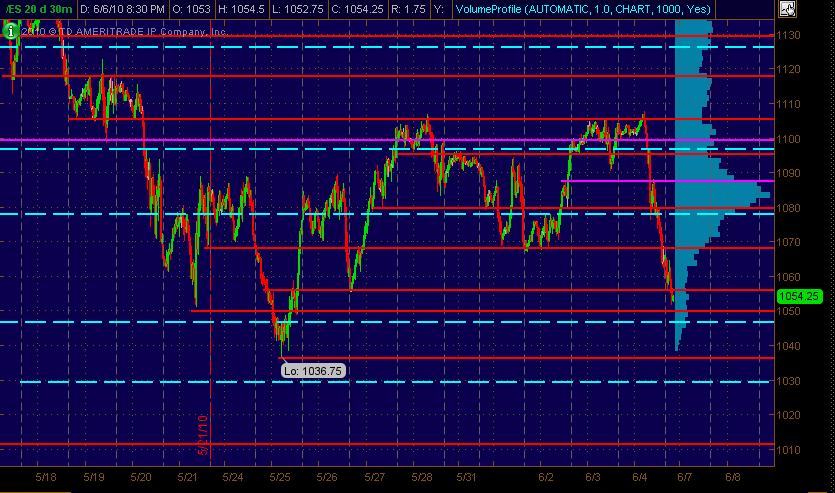
Here's my charts with Price Action S/R levles ... significant ones in Red and semi-significant in Magenta. The Cyan dashed lines are the Weekly Pivot levels.
First is the Daily ES chart:
And the 30-minute bar chart of 20 days:
KO
koolblue
Rep: 48,651
Posts: 16,032
Next 5 min bar could contain a short term (5 min ) peak... we'll see
PH
phileo
Rep: 3,062
Posts: 520
Originally posted by phileo
big breakout left another air pocket 1065.25 - 1065.75
will this one fill?
If not, that would be two unfilled air pockets .... bullish.
long 1065.5.
PH
phileo
Rep: 3,062
Posts: 520
Originally posted by phileo
big breakout left another air pocket 1065.25 - 1065.75
will this one fill?
If not, that would be two unfilled air pockets .... bullish.
long 1065.5.
stop to 1065, target 1067.5
PH
phileo
Rep: 3,062
Posts: 520
Originally posted by phileo
big breakout left another air pocket 1065.25 - 1065.75
will this one fill?
If not, that would be two unfilled air pockets .... bullish.
long 1065.5.
stop to 1065, target 1067.5
exit 1066.5 ....
KO
koolblue
Rep: 48,651
Posts: 16,032
As it turned out , 1067.50was a good short scalp , as suspected.. see how they have to pause at the 1.618 1063.75? i think it gives way and they go for 1061.25 but the air is a little lower at 1060.25 so im not quite sure how to play it ...if it even gets down there
!
!
KO
koolblue
Rep: 48,651
Posts: 16,032
Dam! ...gotta get some rest... only 3 hours sleep so far!.. dont forget the number at the top of the chart! 1077.25!.. Thats a magnet, imho!...Good trading all!
PH
phileo
Rep: 3,062
Posts: 520
long 1066, 2/4 stop/T1
vwap and EMA's are lining up with that recent dip to 1064.
PH
phileo
Rep: 3,062
Posts: 520
Originally posted by phileo
long 1066, 2/4 stop/T1
vwap and EMA's are lining up with that recent dip to 1064.
out 1067
sufferin' succotash
1067 is cursed voodooo