ES Short Term Trading 6-7-10
Here's my charts with Price Action S/R levles ... significant ones in Red and semi-significant in Magenta. The Cyan dashed lines are the Weekly Pivot levels.
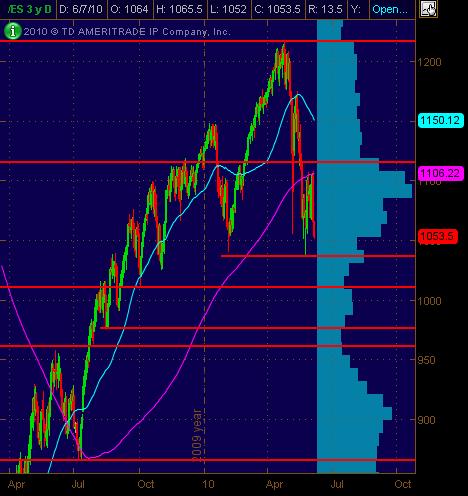
First is the Daily ES chart:
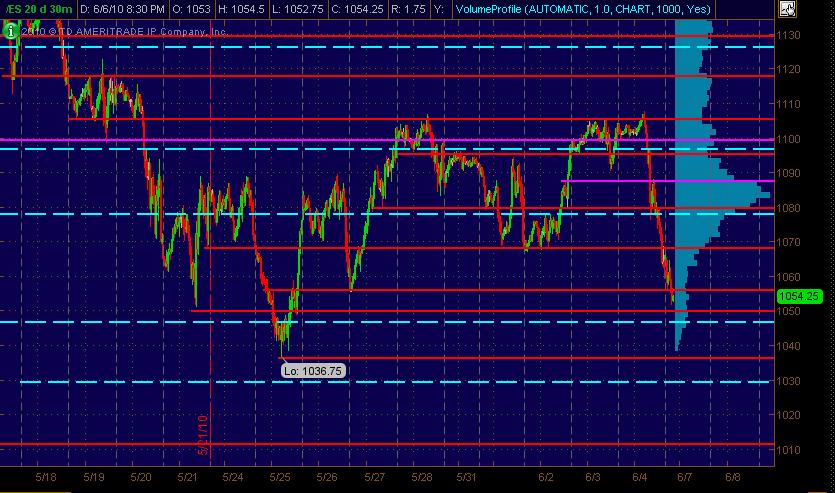
And the 30-minute bar chart of 20 days:
First is the Daily ES chart:
Click image for original size
And the 30-minute bar chart of 20 days:
Click image for original size
as long as trade has taken place one tick above or below a triple then it has been run and no longer has meaning to me....
I don't use them in O/N trade just RTH session 9:30 - 4:15 EST
I don't use them in O/N trade just RTH session 9:30 - 4:15 EST
Originally posted by MonkeyMeat
Walking it down ...
1080 is signif PASR (resistance) with
1078 as Wkly Mid Pvt
1068-1065 PASR (resistance)
1047 is Wkly S1 Pvt
1042 Daily S2 (as per my ThinkorSwim software)
1041-1037 PASR zone on Daily chart as potential signif support
1010 zone is next Daily PASR (support) if all hell breaks loose
Hope some find this "map" helpful!
Overnite globex has rallied +18pts from 1052, and has been quite active. Euro has also rallied from 1.189, unfortunately, is has failed to hold above Friday's lows.
1088.25 - 1091.75 - major air
1081 - this was a key level were selloff's and rallies started last week.
1078-1079: weekly pp + fri's o/n lo + POC
1069 - 1071: Memorial Day + Wed.globex dbl bottom low + today's o/n hi + VAL
1052 : o/n lo
1066 - Fri. gap fill.
1059 - Fri. Lo
im going to short the open.
Originally posted by PAUL9
FWIW
OK
I found my file on Miller and if Friday wasn't a monster trend down day then I don't know what is...
Here is my opriginal note to myself after being a reader of miller's journal for about 5 or 6 weeks in 2009:
***************************************
One of Don's favorite set-up is described in 03/09/09 TD blog:
1) monster decline previous day
2) next day, gap down to prior day support, BUY tick under -720
***************************************
Well, support from Friday looks like 1065 to 1059.
Well, we gapped up above 1066 to open, so we don't have his setup exactly.
However, I think the -ve TICK extreme into a support confluence has some merit, and will watch for that...
ok im out at 64.5
I'll be watching same a you, Phileo...
under current circumstances makes Bruce's AH Midpoint look particularly interesting, 61.38, I smell a rat.
under current circumstances makes Bruce's AH Midpoint look particularly interesting, 61.38, I smell a rat.
Originally posted by feng456
im going to short the open.
Hi Feng,
Did you keep a runner on ?
Originally posted by PAUL9
I'll be watching same a you, Phileo...
under current circumstances makes Bruce's AH Midpoint look particularly interesting, 61.38, I smell a rat.
Well, we got the -ve TICK extreme. Unfortunately, the nearest support that I saw was 1059. Bruce's RAT 1061.5 would have worked nicely !!
Originally posted by PAUL9
wow, got that extreme neg $tick reading right at the rat.
Dang.... 1061 might be the RTH LoD.....
did anyone go long ??????
Originally posted by BruceM
a bad close below that spike bars low leads me to believe that the 38 - 37.50 will be tested soon...
probably overnight eh?
Emini Day Trading /
Daily Notes /
Forecast /
Economic Events /
Search /
Terms and Conditions /
Disclaimer /
Books /
Online Books /
Site Map /
Contact /
Privacy Policy /
Links /
About /
Day Trading Forum /
Investment Calculators /
Pivot Point Calculator /
Market Profile Generator /
Fibonacci Calculator /
Mailing List /
Advertise Here /
Articles /
Financial Terms /
Brokers /
Software /
Holidays /
Stock Split Calendar /
Mortgage Calculator /
Donate
Copyright © 2004-2023, MyPivots. All rights reserved.
Copyright © 2004-2023, MyPivots. All rights reserved.