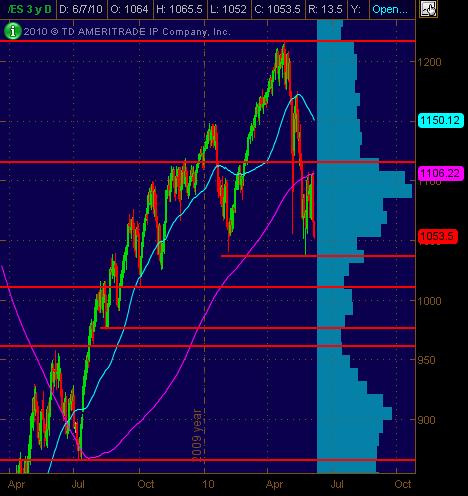
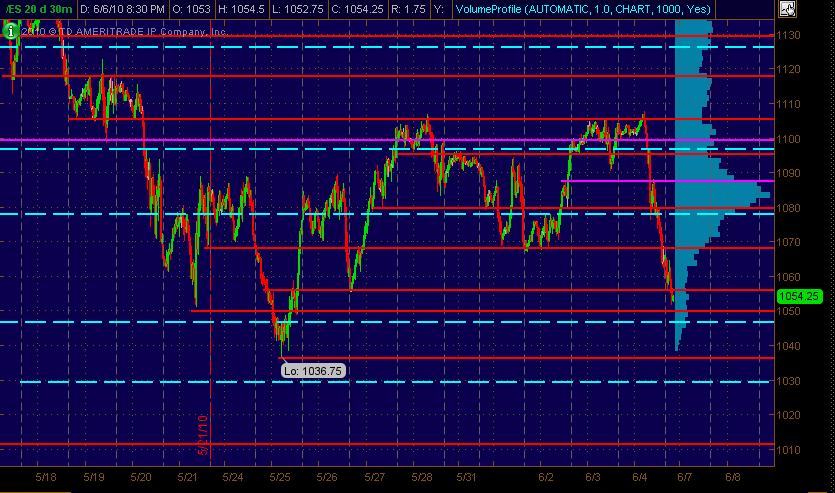
Here's my charts with Price Action S/R levles ... significant ones in Red and semi-significant in Magenta. The Cyan dashed lines are the Weekly Pivot levels.
First is the Daily ES chart:
And the 30-minute bar chart of 20 days:
KO
koolblue
Rep: 48,651
Posts: 16,032
see? this is why im such a lousy trader... i KNEW 1064 was in the cards and likely 1067 .. just no guts!
PH
phileo
Rep: 3,062
Posts: 520
Originally posted by koolblue
Hopefully they will go for the 5 min air at 1060.25?
THere was an air pocket 1062.5, and that filled, but we haven't seen anything below that ever since the fill.
KoolBlue, looks like it might tag your 1067 target. 1066.5 was the open.
PH
phileo
Rep: 3,062
Posts: 520
Originally posted by koolblue
Incidently , my guess for the lod is 1057.50...time will tell!
1061 was my guess, I got that one totally wrong!
Your guess is looking good, I'm seeing TICK strength after the break back above 1060
PH
phileo
Rep: 3,062
Posts: 520
big breakout left another air pocket 1065.25 - 1065.75
will this one fill?
If not, that would be two unfilled air pockets .... bullish.
will this one fill?
If not, that would be two unfilled air pockets .... bullish.
KO
koolblue
Rep: 48,651
Posts: 16,032
its early.. that one and 1060.25 could both still fill in time, tho my best guess would be for a slight upside close today.. we'll have to see