ES Short Term Trading 6-7-10
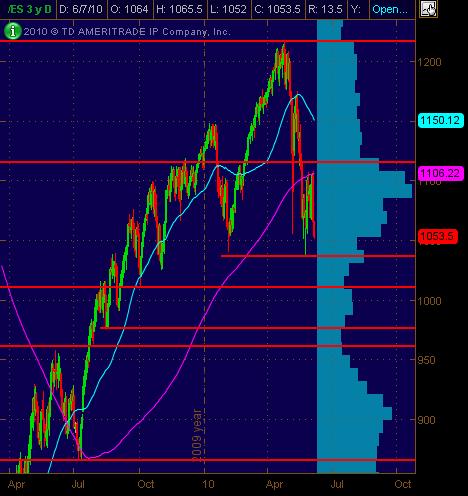
Here's my charts with Price Action S/R levles ... significant ones in Red and semi-significant in Magenta. The Cyan dashed lines are the Weekly Pivot levels.
First is the Daily ES chart:
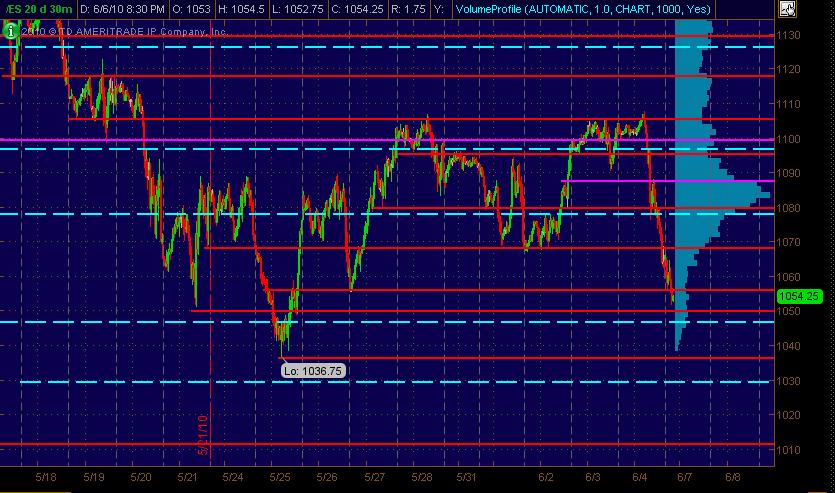
And the 30-minute bar chart of 20 days:
First is the Daily ES chart:
Click image for original size
And the 30-minute bar chart of 20 days:
Click image for original size
Walking it down ...
1080 is signif PASR (resistance) with
1078 as Wkly Mid Pvt
1068-1065 PASR (resistance)
1047 is Wkly S1 Pvt
1042 Daily S2 (as per my ThinkorSwim software)
1041-1037 PASR zone on Daily chart as potential signif support
1010 zone is next Daily PASR (support) if all hell breaks loose
Hope some find this "map" helpful!
And don't forget to keep an eye on Bruce's RATCHETS among other things from Kools weekend analysis etc. ... along with your own stuff.
And anyone who is unfamiliar with Bruce's concept of "air" ... "triples" ... or "ratchets" ... he's got (and may provide a link(s) to what they mean here in subsequent posts). [sorry for any xtra posting work I'm promoting here for ya Bruce]
MM
And anyone who is unfamiliar with Bruce's concept of "air" ... "triples" ... or "ratchets" ... he's got (and may provide a link(s) to what they mean here in subsequent posts). [sorry for any xtra posting work I'm promoting here for ya Bruce]
MM
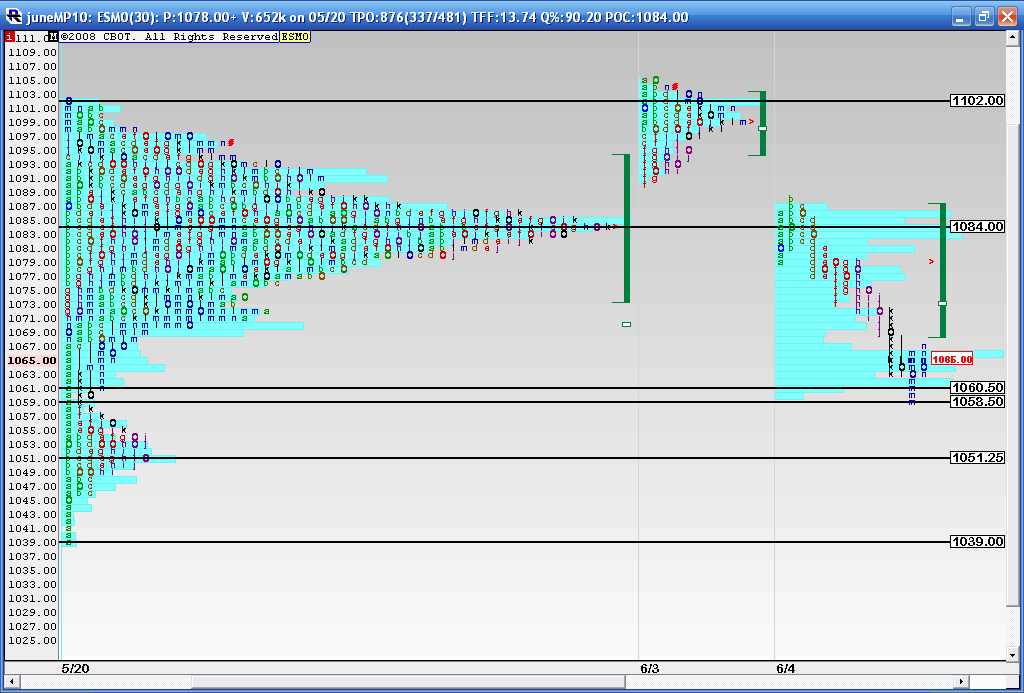
Here is my MP chart....we are looking at the failed break out up and then the gap on Friday below the key 84 - 87.50 zone ( big volume here). Although not coming up at the right spot due to scaling, the 1056.00 area will be a critical close as this is the low of the spike bar from May 6th...The RTH wants to try and hold that close I think...This also comes close to the low volume zone of 58 - 60 so I like that 56 - 60 zone...although a big zone but it also includes fridays low. This chart shows the consolidation we have been in since May 20th and then I seperated out last thursday and fridays trade..
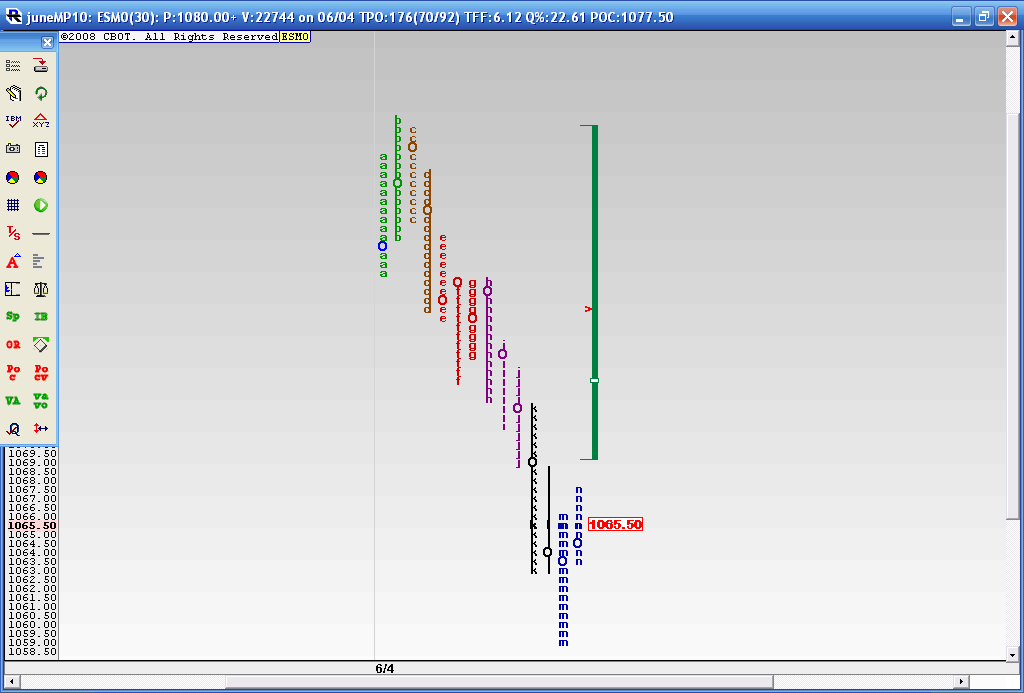
Here is just Fridays chart. You can see how we started trending at letter 'd' and we never traded above a previous 30 minute bars high very far... the key price clusters ( overlapping 30 minute bars ) are at
63.50 - 66
77 - 79
82 - 85
Click image for original size
Here is just Fridays chart. You can see how we started trending at letter 'd' and we never traded above a previous 30 minute bars high very far... the key price clusters ( overlapping 30 minute bars ) are at
63.50 - 66
77 - 79
82 - 85
Click image for original size
Btw, blew thru 1000 plus daily equity charts ... and nothing looks good long really (although there's always the oversold rubber band effect that can hit). Out of all the eyeballing I saw only 2 stocks that may be decent longs if the mkt bounces:
NFLX
AKAM
and maybe (with a question mark or two) AAPL
NFLX
AKAM
and maybe (with a question mark or two) AAPL
You know, I've taken a stab at these longer term MP charts with mixed results so I'm not sure if I'm going to uncover anything new that we can't see from other methods. The reality is that we have been stuck between that spike bars low at 1056 and 1100 for quite a while. With the 1083 - 1085 attracting the most volume. So we are bracketing which is just another term for consolidation.
That said and looking at what is happening in the Overnight I'm using the follwoing areas to trade from unless something drastic happens bewteen now at the 9:30 open. Keeping in mind a "sell the rallies " mindset due to the trend day yesterday and the fact that we break a previous weeks lows and/or high quite often. 1081.25 - 1084 will be the filter for me as to which range we trade to first, so being below it has me assuming we will break last weeks low first.
The numbers:
81.25 - 84 Rat and HV from Longer term profile
1075 - 77 Rat and POC
1068 - 1070 - Va low, O/N high , Rat
1061 - 63 RAT and O/N Volume sipikes
55 -56.25 key spike low and Rat
50 - 51 O/N Low and RAt
Looking for todays Value area to develop somewhere below 77 and only TIME spent above there will change that theory....So we should see Overlapping to lower Value form today..If I had to guess at the Rats that should trade it will be these three..75, 68.75 and 61.50...
I hope we all do well today.
One last thing...Dalton talks about how bracket extremes get tested quite often so we need to keep in mind that all of this could just be smoke and mirrors...meaning that as long as we are stuck in this 1056 - 1100 range then we can see trend days and all sorts or garbage without it meaning anything for the longer term picture.
That's my way of trying to remind myself to be flexible and not got locked into a viewpoint based on one days trading!!
As we go towards expiration, the smarter traders will write down all the gaps and key inflection points from the JUNE contract.....these will be key when we roll to the new contract
FWIW
OK
I found my file on Miller and if Friday wasn't a monster trend down day then I don't know what is...
Here is my opriginal note to myself after being a reader of miller's journal for about 5 or 6 weeks in 2009:
***************************************
One of Don's favorite set-up is described in 03/09/09 TD blog:
1) monster decline previous day
2) next day, gap down to prior day support, BUY tick under -720
***************************************
Well, support from Friday looks like 1065 to 1059.
Little trade at 64 in O/N so if u r short u need to be aware of that point..Volume coming into 70 at the VA low
Hey guys,
I just started trading again last week and all your numbers have been helping me out. I like the triples and air but I still don't think I fully grasp them but here is a quick question.
Bruce - If you look at a 5 min. chart for today. Do the Bars at 5:00am 5:05am and 5:10am make a triple? or are they 'cancelled' out by the 5:20 bar?
Is gap down defined as an open under the previous days close??
A 25 point RTH range is a not a monster range to me but if we include the gap down then we look like a big range....so I may take some grief on that comment but it's just the way I think of it.....did big money participate in only half of that big range move if they missed sells up at 1107 area in O/N..?
A 25 point RTH range is a not a monster range to me but if we include the gap down then we look like a big range....so I may take some grief on that comment but it's just the way I think of it.....did big money participate in only half of that big range move if they missed sells up at 1107 area in O/N..?
Originally posted by BruceM
a bad close below that spike bars low leads me to believe that the 38 - 37.50 will be tested soon...
probably overnight eh?
Emini Day Trading /
Daily Notes /
Forecast /
Economic Events /
Search /
Terms and Conditions /
Disclaimer /
Books /
Online Books /
Site Map /
Contact /
Privacy Policy /
Links /
About /
Day Trading Forum /
Investment Calculators /
Pivot Point Calculator /
Market Profile Generator /
Fibonacci Calculator /
Mailing List /
Advertise Here /
Articles /
Financial Terms /
Brokers /
Software /
Holidays /
Stock Split Calendar /
Mortgage Calculator /
Donate
Copyright © 2004-2023, MyPivots. All rights reserved.
Copyright © 2004-2023, MyPivots. All rights reserved.