ES short term trading 6-22-10
Looking for sells on any moves up with high $ticks this am...key resistence zone is 17- 20......not sure if it will get up there so look for a plus 2.5 - 4 off open print up to fade
Paul , here is a chart I just did for you as I think this will serve you well over time.....Note how the last 15 minutes of the day only fills in part of that air formed off the 30 minute bars...the rest of it was filled in with not only the O/N trade but also when we opened today
Click image for original size
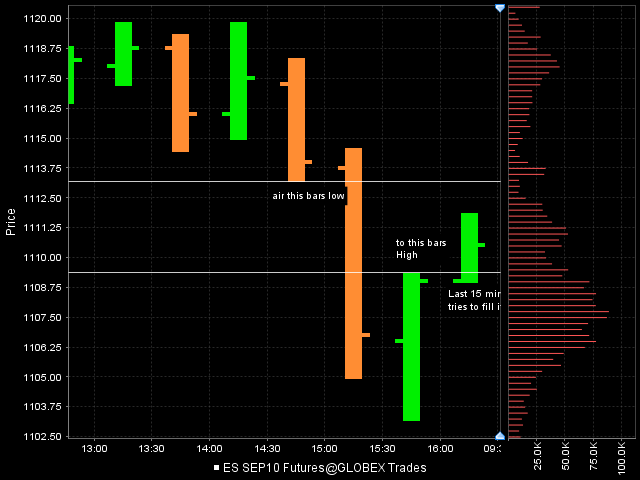
even If I end up being completely wrong on the timing you should keep track of those areas...they like to fill in the second air formed off 30 minutes...It takes very strong selling (or buying) to make those NOT fill in....like anything else it does happen on big flush out moves
last 15 minute will print 92.75!!
I see what you're saying.
thanks.
thanks.
to follow up on the 30min air,
in today's session
Am I correct that on 30min chart there is "air" still open 1098 to 1101.25?
in today's session
Am I correct that on 30min chart there is "air" still open 1098 to 1101.25?
Let me own up to be completely wrong on this...it didn't happen
In general I think forums contain too many making predictions that don't happen and then you never hear about it...
The point with this concept is IF we had 30 minute left in the day and we didn't trade back to 92.75 then that would be the third air pocket in a row that didn't fill in.....
The overnight will be interesting especially with the fed day tomorrow
Originally posted by BruceM
lasst 15 minute will print 92.75!!
correct Paul and look at the bar before that...there is air there too from that break down bar to the low of the first 90 minutes of trade that held so long...these are known as single prints in MP terms......so important that Investor r/t and other software draws lines for you automatically..at the 30 minute air...the very best 30 minute air will also contain one minute and 5 minute air..!!
Originally posted by PAUL9
to follow up on the 30min air,
in today's session
Am I correct that on 30min chart there is "air" still open 1098 to 1101.25?
Originally posted by BruceM
correct Paul and look at the bar before that...there is air there too from that break down bar to the low of the first 90 minutes of trade that held so long...these are known as single prints in MP terms......so important that Investor r/t and other software draws lines for you automatically..at the 30 minute air...the very best 30 minute air will also contain one minute and 5 minute air..!!
How do you set that feature up in Investor R/T?
Originally posted by BruceM
some random thoughts....
Expecting 40 points of range based on the 3war etc......so we traded 1125 yeaterdays...based just on that price we will see 1100 or 1150.....before next mondays open...that would be two main Rats....
but more important we can project where those rats will hit using mondays and todays trade....
If Mondays high holds then we can subtract the 3 war from that high so we should see 1100 easily....
If we get an inside bar today with an up close then we need to entertain the POSSIBILITY that the OVB may fail to trade lower and we can add the 3 war to Mondays low....just some thoughts rattling through my head
Hi Bruce, When you calculate the 3 WAR - do you use RTH of rolling 5 days as a week to calculate new 3 WAR everyday or do you use RTH of Mon to Fri as a week?
Thanks a lot for all your insight and analysis in real-time.
Hari
You calculate the 3 war on Fridays close for the following week. It doesn't change and doesn't roll...In general you want to look at monday and tuesdays range for the weekly direction.. it lasts the entire week. Some have told me that if we reach a full 3 war by Wednesdays close then we are then setting up for a reversal...I haven't specifically noticed that but don't always follow the 3 war as closely as I probably should...we are getting close to a full 3 WAR already this week...You can also look at the weekly midpoint after Tuesday closes but that won't take precedence over price action and Profile points
Originally posted by hari
Originally posted by BruceM
some random thoughts....
Expecting 40 points of range based on the 3war etc......so we traded 1125 yeaterdays...based just on that price we will see 1100 or 1150.....before next mondays open...that would be two main Rats....
but more important we can project where those rats will hit using mondays and todays trade....
If Mondays high holds then we can subtract the 3 war from that high so we should see 1100 easily....
If we get an inside bar today with an up close then we need to entertain the POSSIBILITY that the OVB may fail to trade lower and we can add the 3 war to Mondays low....just some thoughts rattling through my head
Hi Bruce, When you calculate the 3 WAR - do you use RTH of rolling 5 days as a week to calculate new 3 WAR everyday or do you use RTH of Mon to Fri as a week?
Thanks a lot for all your insight and analysis in real-time.
Hari
Originally posted by BruceM
Piker...in your Market profile chart go to "preferences" and then "reference lines"...there is a check box for "singles"..let me know if you get it going
Ok, I got it checked. For some reason I found it located in a different spot; i.e., under the "prices levels" tab but I'm sure it is the same setting as yours.
Emini Day Trading /
Daily Notes /
Forecast /
Economic Events /
Search /
Terms and Conditions /
Disclaimer /
Books /
Online Books /
Site Map /
Contact /
Privacy Policy /
Links /
About /
Day Trading Forum /
Investment Calculators /
Pivot Point Calculator /
Market Profile Generator /
Fibonacci Calculator /
Mailing List /
Advertise Here /
Articles /
Financial Terms /
Brokers /
Software /
Holidays /
Stock Split Calendar /
Mortgage Calculator /
Donate
Copyright © 2004-2023, MyPivots. All rights reserved.
Copyright © 2004-2023, MyPivots. All rights reserved.